


Rising home prices and mortgage rates have potential homebuyers struggling to save a down payment or qualify for mortgage at all. Often, FHA is the answer.
These mortgages, backed by the Federal Housing Administration (FHA), provide more lenient terms and low down payments of only 3.5%. As home prices and cost of living outpace wage growth, FHA financing is becoming a bigger part of the lending picture in the U.S.
FHA loan volume grew 4.8% annually in 2025 and outpaced overall purchase originations for the last three years. The FHA share of total originations rose from 15.9% in 2022 to 20.3% in 2025 — the highest percentage since at least 2018.
FHA is doing what it was always meant to do: offer a path to homeownership when conventional lending is off the table.
FHA Mortgages by State
FHA loans don't require a specific income level or first-time buyer status. Even so, they're popular with lower-income borrowers and first-timers because of their flexible qualifying standards.
States with more affordable housing markets tend to see higher FHA usage. Buyers in these areas are more likely to need the lower down payment and credit flexibility FHA loans offer.
To find where FHA loans are most common, Mortgage Research Network analyzed the latest Home Mortgage Disclosure Act (HMDA) data for 2025 using Polygon Research's HMDAVision. More than 1,200 lenders originated around 638,000 owner-occupied FHA purchase mortgages on 1–4 unit properties.
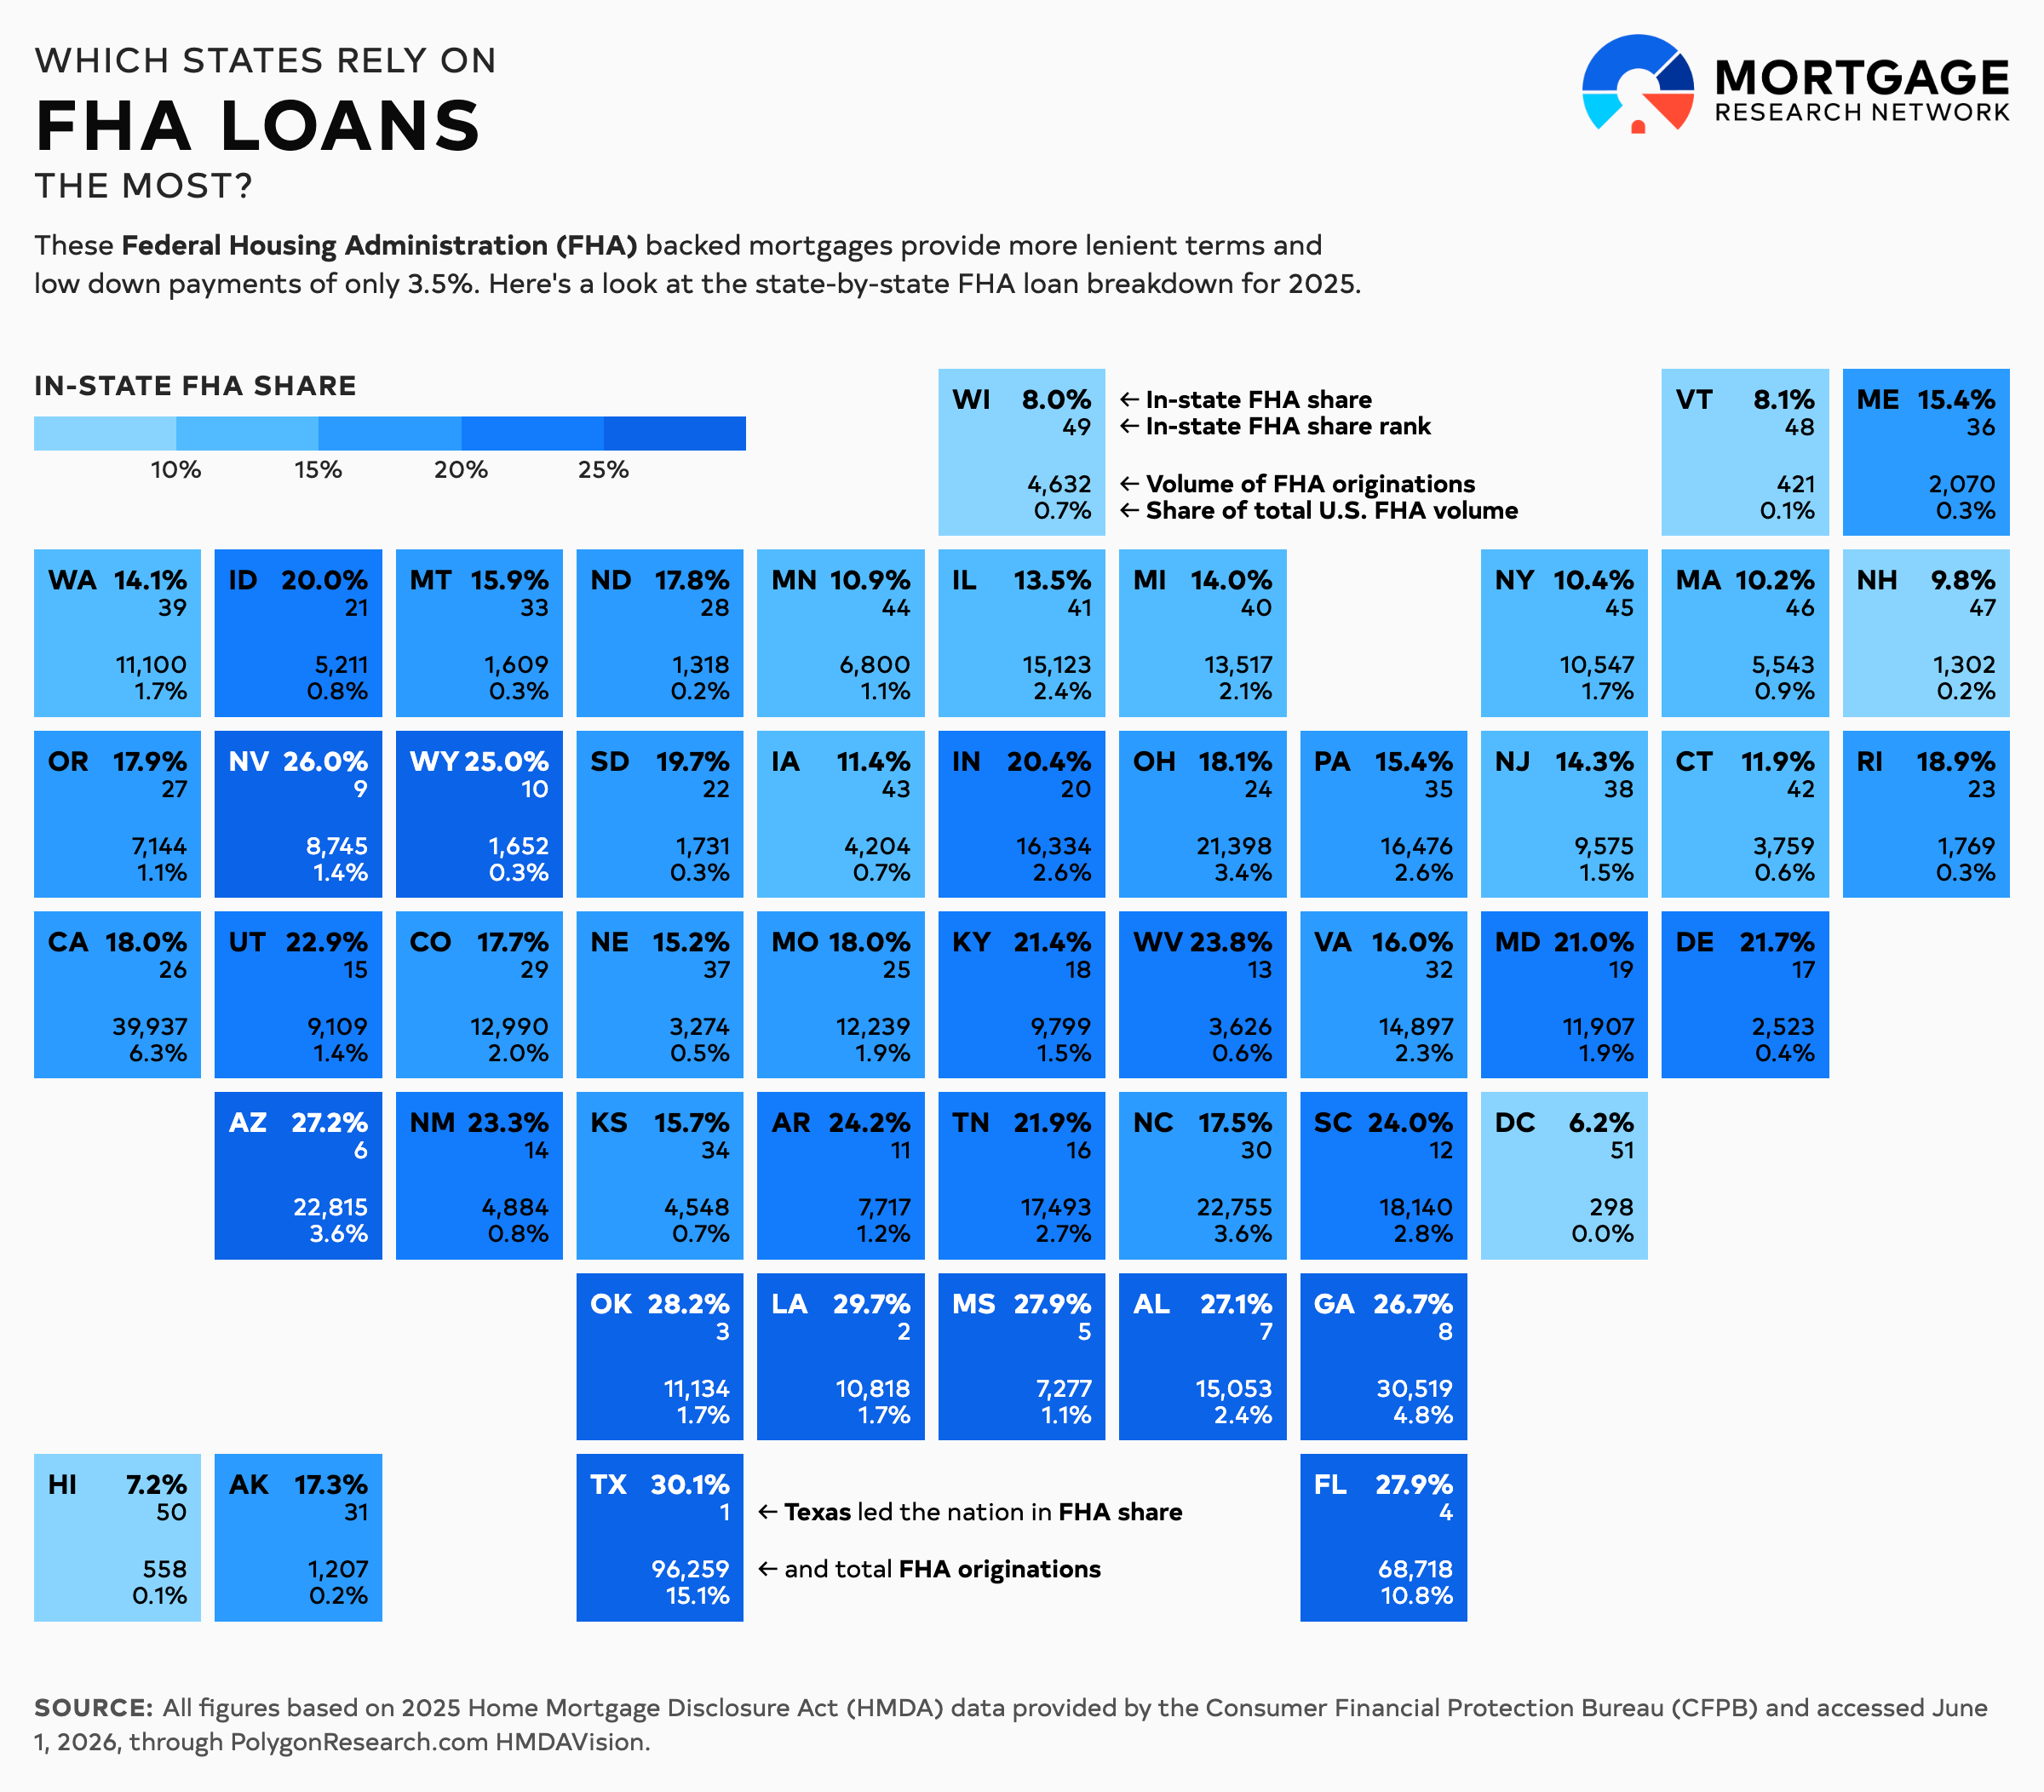
Texas led the nation in FHA share — and total FHA originations — with the loan type making up 30.1% of all purchase loans in the state. Louisiana (29.7%), Oklahoma (28.2%), Florida (27.9%), and Mississippi (27.9%) rounded out the top five by share.
Hawaii saw the biggest year-over-year jump in FHA volume at 33.5%, though it was based on just 558 loans. Vermont (25.7%), Idaho (17.6%), Montana (17.1%), and South Carolina (15.4%) also posted strong annual gains.
The table below breaks down FHA purchase origination data by state, based on 2025 HMDA data.
| Rank | State | In-State FHA Share | FHA Originations | FHA YoY | Share of Total U.S. FHA Volume |
|---|---|---|---|---|---|
| 1 | Texas | 30.10% | 96,259 | 4.80% | 15.10% |
| 2 | Louisiana | 29.70% | 10,818 | 3.40% | 1.70% |
| 3 | Oklahoma | 28.20% | 11,134 | 11.50% | 1.70% |
| 4 | Florida | 27.90% | 68,718 | 2.60% | 10.80% |
| 5 | Mississippi | 27.90% | 7,277 | 2.90% | 1.10% |
| 6 | Arizona | 27.20% | 22,815 | 3.30% | 3.60% |
| 7 | Alabama | 27.10% | 15,053 | 6.20% | 2.40% |
| 8 | Georgia | 26.70% | 30,519 | 6.90% | 4.80% |
| 9 | Nevada | 26.00% | 8,745 | -4.50% | 1.40% |
| 10 | Wyoming | 25.00% | 1,652 | 15.10% | 0.30% |
| 11 | Arkansas | 24.20% | 7,717 | 15.30% | 1.20% |
| 12 | South Carolina | 24.00% | 18,140 | 15.40% | 2.80% |
| 13 | West Virginia | 23.80% | 3,626 | 0.90% | 0.60% |
| 14 | New Mexico | 23.30% | 4,884 | -0.70% | 0.80% |
| 15 | Utah | 22.90% | 9,109 | -3.40% | 1.40% |
| 16 | Tennessee | 21.90% | 17,493 | 7.10% | 2.70% |
| 17 | Delaware | 21.70% | 2,523 | 1.80% | 0.40% |
| 18 | Kentucky | 21.40% | 9,799 | 7.20% | 1.50% |
| 19 | Maryland | 21.00% | 11,907 | -0.10% | 1.90% |
| 20 | Indiana | 20.40% | 16,334 | 5.10% | 2.60% |
| 21 | Idaho | 20.00% | 5,211 | 17.60% | 0.80% |
| 22 | South Dakota | 19.70% | 1,731 | 5.50% | 0.30% |
| 23 | Rhode Island | 18.90% | 1,769 | -5.60% | 0.30% |
| 24 | Ohio | 18.10% | 21,398 | 10.50% | 3.40% |
| 25 | Missouri | 18.00% | 12,239 | 9.40% | 1.90% |
| 26 | California | 18.00% | 39,937 | 0.00% | 6.30% |
| 27 | Oregon | 17.90% | 7,144 | 4.60% | 1.10% |
| 28 | North Dakota | 17.80% | 1,318 | -9.20% | 0.20% |
| 29 | Colorado | 17.70% | 12,990 | 4.10% | 2.00% |
| 30 | North Carolina | 17.50% | 22,755 | 11.30% | 3.60% |
| 31 | Alaska | 17.30% | 1,207 | 13.70% | 0.20% |
| 32 | Virginia | 16.00% | 14,897 | 4.70% | 2.30% |
| 33 | Montana | 15.90% | 1,609 | 17.10% | 0.30% |
| 34 | Kansas | 15.70% | 4,548 | 7.20% | 0.70% |
| 35 | Pennsylvania | 15.40% | 16,476 | 6.30% | 2.60% |
| 36 | Maine | 15.40% | 2,070 | 14.00% | 0.30% |
| 37 | Nebraska | 15.20% | 3,274 | 13.10% | 0.50% |
| 38 | New Jersey | 14.30% | 9,575 | -7.40% | 1.50% |
| 39 | Washington | 14.10% | 11,100 | 5.30% | 1.70% |
| 40 | Michigan | 14.00% | 13,517 | 6.70% | 2.10% |
| 41 | Illinois | 13.50% | 15,123 | -0.60% | 2.40% |
| 42 | Connecticut | 11.90% | 3,759 | 2.10% | 0.60% |
| 43 | Iowa | 11.40% | 4,204 | 4.70% | 0.70% |
| 44 | Minnesota | 10.90% | 6,800 | 9.30% | 1.10% |
| 45 | New York | 10.40% | 10,547 | -1.90% | 1.70% |
| 46 | Massachusetts | 10.20% | 5,543 | -0.10% | 0.90% |
| 47 | New Hampshire | 9.80% | 1,302 | 13.60% | 0.20% |
| 48 | Vermont | 8.10% | 421 | 25.70% | 0.10% |
| 49 | Wisconsin | 8.00% | 4,632 | 5.10% | 0.70% |
| 50 | Hawaii | 7.20% | 558 | 33.50% | 0.10% |
| 51 | District of Columbia | 6.20% | 298 | 10.40% | 0.00% |
Applying for an FHA Loan
The government-backed mortgages insured by the FHA were designed for borrowers without sizable down payments and those unable to meet credit or income requirements of conventional loans. Due to those potential risk factors for the lender, FHA loans limits sit lower compared to conforming mortgages.
To qualify for an FHA mortgage, you’ll need 3.5% down, a credit score above 500 (though most lenders want at least 620), a debt-to-income ratio typically no higher than 55%, and you must be purchasing a primary residence.
While FHA loans provide flexible income and debt requirements, that flexibility comes at a cost. FHA loans tend to have higher APRs due to upfront and monthly mortgage insurance premiums (MIP). However, base FHA mortgage rates are often lower than those for conventional loans.
For further information, see MRN’s comprehensive guide on FHA loans.
Find the Right FHA Lender for You
With over 1,200 lenders originating FHA purchase loans in 2025, you have plenty of options to choose from.
A lender that does a lot of FHA financing could make sense since their knowledge and experience can be advantageous. Regardless of who you pick, you should shop for multiple rate quotes in order to better leverage your terms and potentially save money over the loan’s lifetime.
If you’re ready to get started, reach out to a local lender and see what you qualify for.
All figures based on 2025 Home Mortgage Disclosure Act (HMDA) data provided by the Consumer Financial Protection Bureau (CFPB) and accessed June 1, 2026, through PolygonResearch.com HMDAVision.


