


Veterans United Home Loans is a registered DBA of Mortgage Research Center, LLC, an affiliate of Three Creeks Media.
During the second quarter of 2026, lenders originated nearly 175,000 loans backed by the U.S. Department of Veterans Affairs.
However, despite 980 different lenders completing VA loans over the three-month period, the majority were issued by just a handful of companies. During Q2, the ten largest lenders were responsible for 57.1% of the VA mortgage market, with the top five coming in at 45.1%.
Mortgage Research Network analyzed recently released VA-supplied data to identify the largest purchase, IRRRL, cash-out refinance, and overall VA lenders by loans originated spanning April to June 2026.
Largest VA Purchase Lenders
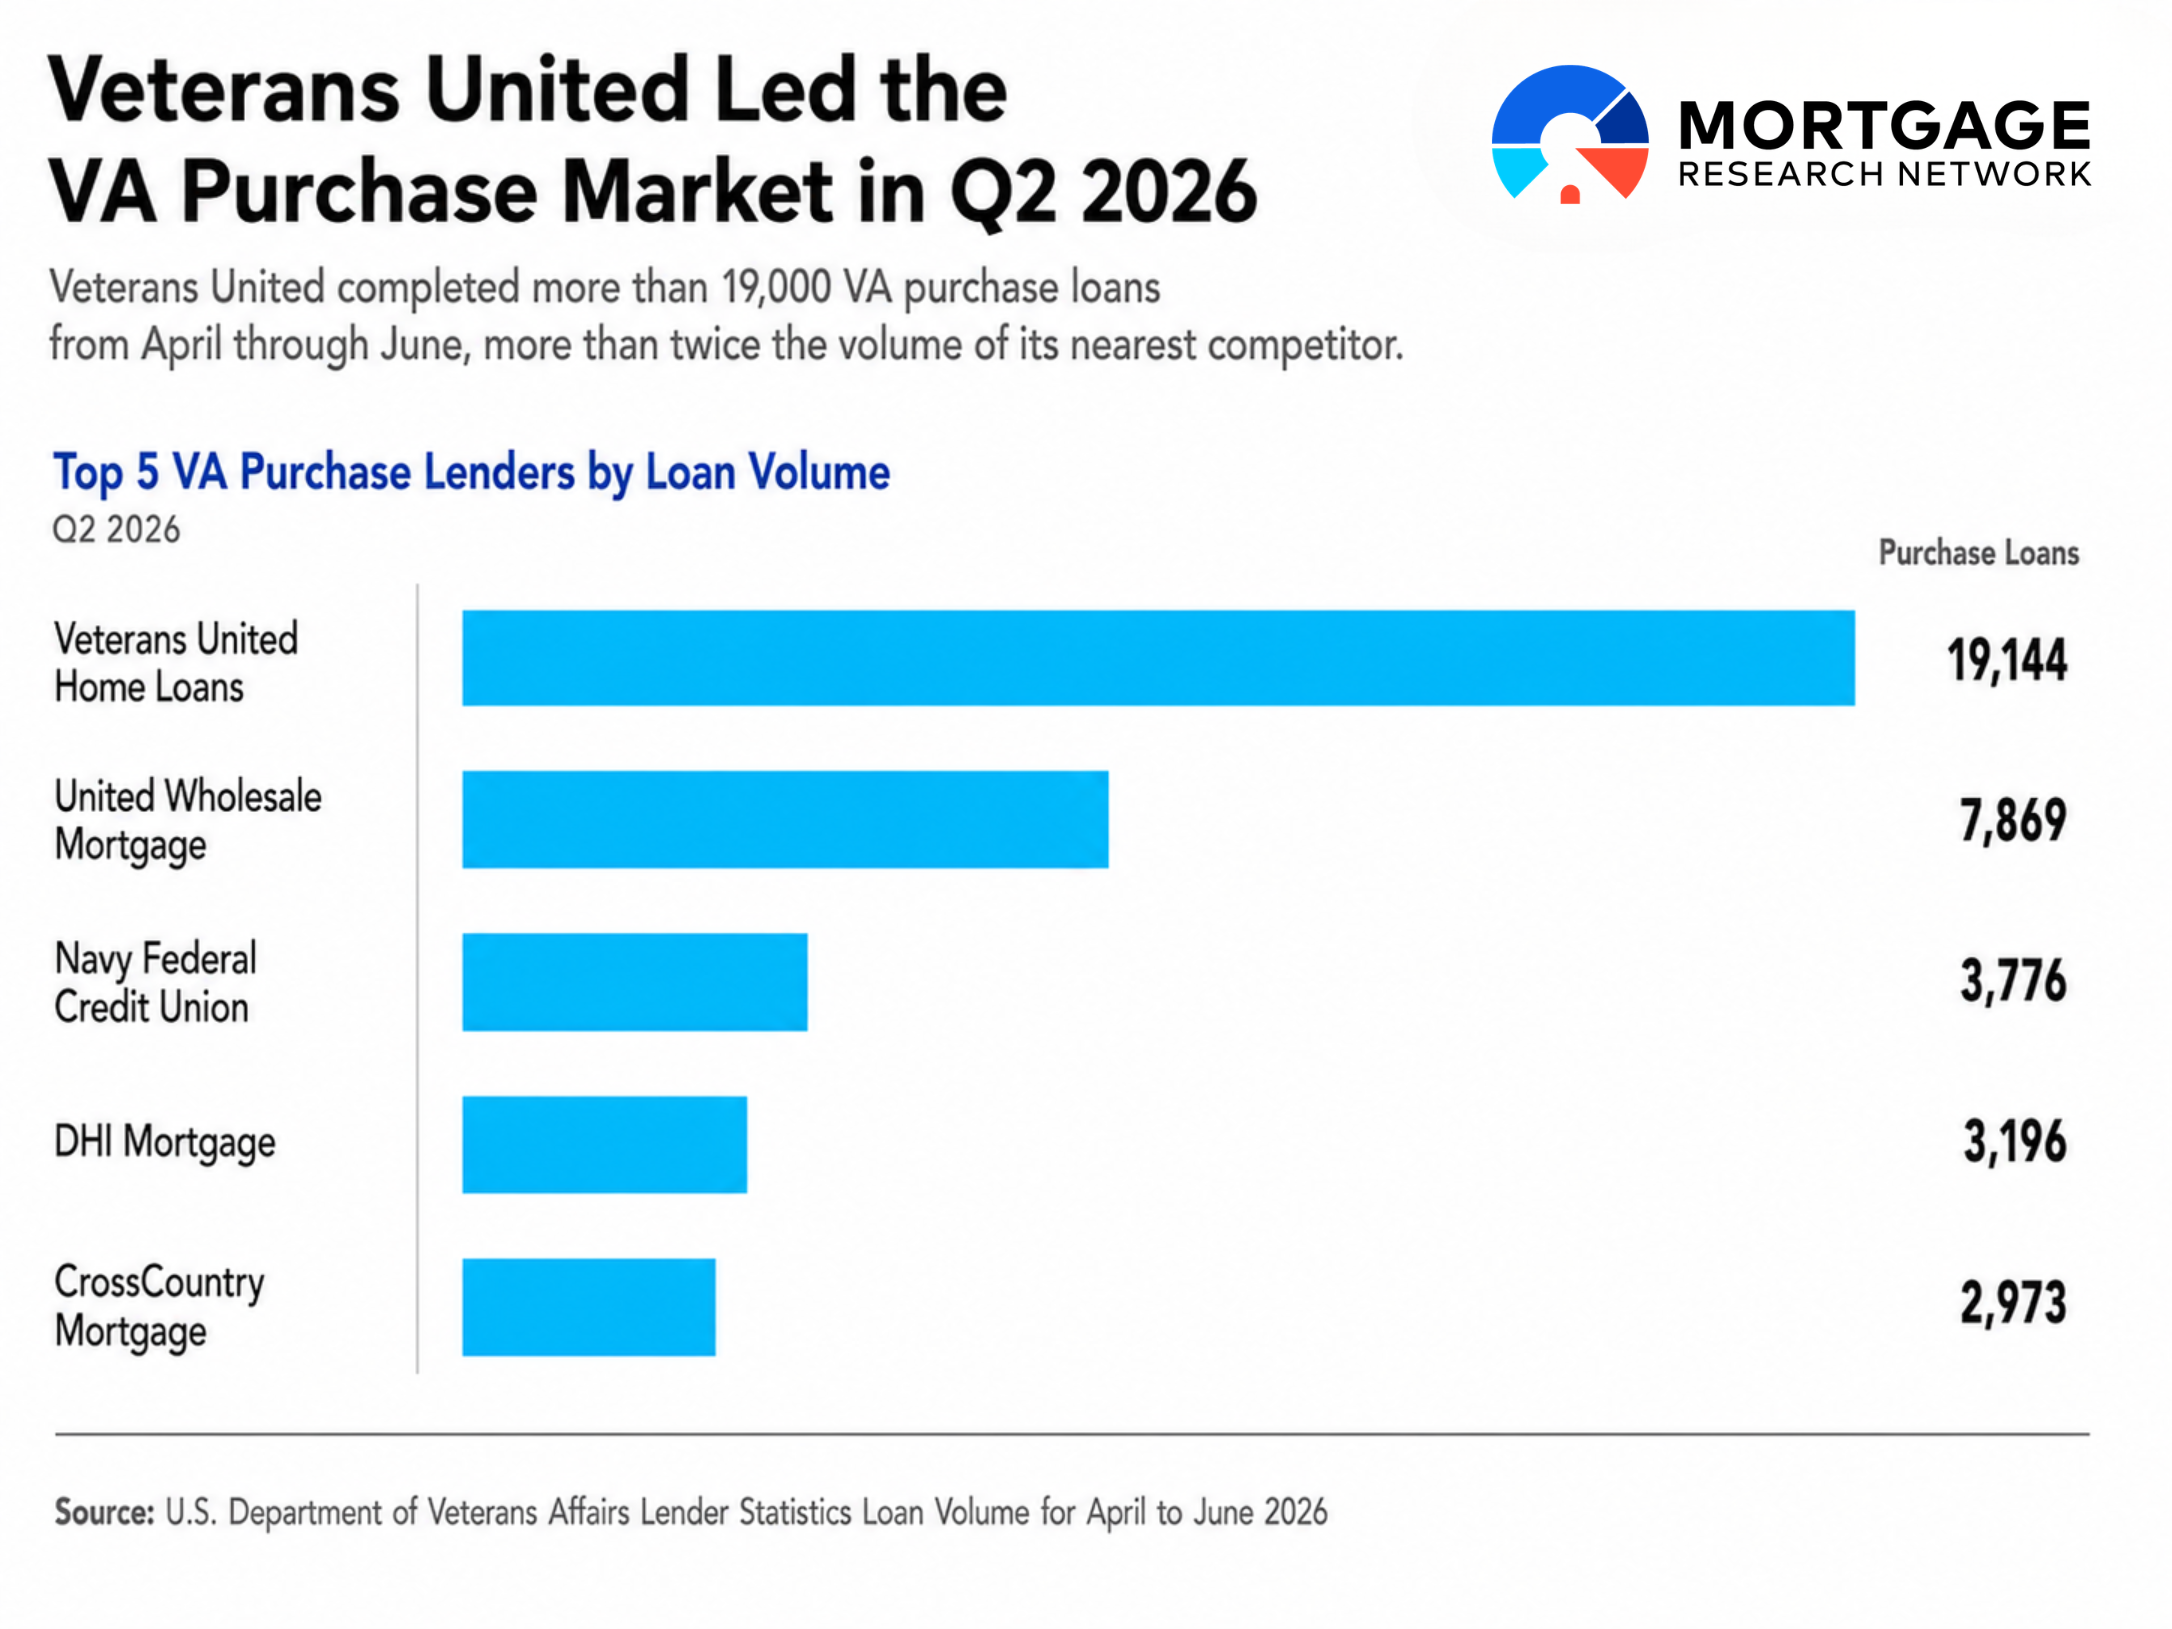
Veterans United Home Loans remained the country’s largest VA purchase lender, originating 19,144 purchase mortgages during Q2 – approximately one out of every five VA purchase loans issued over the period. This represents a 35.1% increase in volume from Q1 and 13.4% over the same period in 2025.
United Wholesale Mortgage ranked second with 7,869 VA purchase loans. Although it remained well behind Veterans United in total purchase volume, UWM saw a higher level of growth, increasing 46.1% quarterly and 68.6% annually.
| Rank | Lender | Q2 2026 Purchase Loans | Quarterly Change | Annual Change |
|---|---|---|---|---|
| 1 | Veterans United Home Loans | 19,144 | 35.10% | 13.40% |
| 2 | United Wholesale Mortgage | 7,869 | 46.10% | 68.60% |
| 3 | Navy Federal Credit Union | 3,776 | 21.60% | 5.60% |
| 4 | DHI Mortgage | 3,196 | 35.80% | 4.90% |
| 5 | CrossCountry Mortgage | 2,973 | 52.90% | 35.30% |
| 6 | Rocket Mortgage | 2,644 | 64.40% | 11.40% |
| 7 | USAA | 1,778 | 15.50% | 2.30% |
| 8 | Guild Mortgage | 1,658 | 28.50% | 7.50% |
| 9 | CMG Financial | 1,582 | 7.00% | 7.00% |
| 10 | Lennar Mortgage | 1,485 | 10.20% | -5.80% |
Nine of the 10 largest purchase lenders recorded both quarterly and annual gains. The only lender with lower year-over-year purchase volume was Lennar, which saw an annual decrease of 5.8%.
The largest quarterly increase among the top 10 belonged to Rocket Mortgage with a rise of 64.4% from 1,608 purchase loans in Q1 to 2,644 in Q2.
Overall, the five largest VA purchase lenders were responsible for 39.6% of Q2 volume, up from 35.7% during Q2 2025.
Purchase Loan Volume Grew Beyond the Spring Rebound
The VA guaranteed a total of 93,236 purchase loans during the second quarter of 2026.
That figure was up 32.5% from Q1, which saw 70,381 purchase loans originated. That rise is unsurprising given the traditional spring homebuying season.
However, purchase loan numbers were also 8.8% higher than the 85,671 loans guaranteed during Q2 2025, which indicates that the quarterly gain was not entirely seasonal.
Purchase dollar volume reached $39.01 billion, up 12.9% from a year earlier. The average purchase loan increased 3.7% annually to $418,365. According to the National Association of Realtors, median existing-home sales prices rose 1.8% year over year in June.
When looking at location for VA purchase loans, Texas led the pack with 12,397 originations. Florida followed in second place with 9,045.
At the county level, the top three locales were:
Bexar County, Texas – 1,549 loans
Maricopa County, Arizona – 1,350 loans
El Paso County, Colorado – 1,225 loans
Largest VA IRRRL Lenders
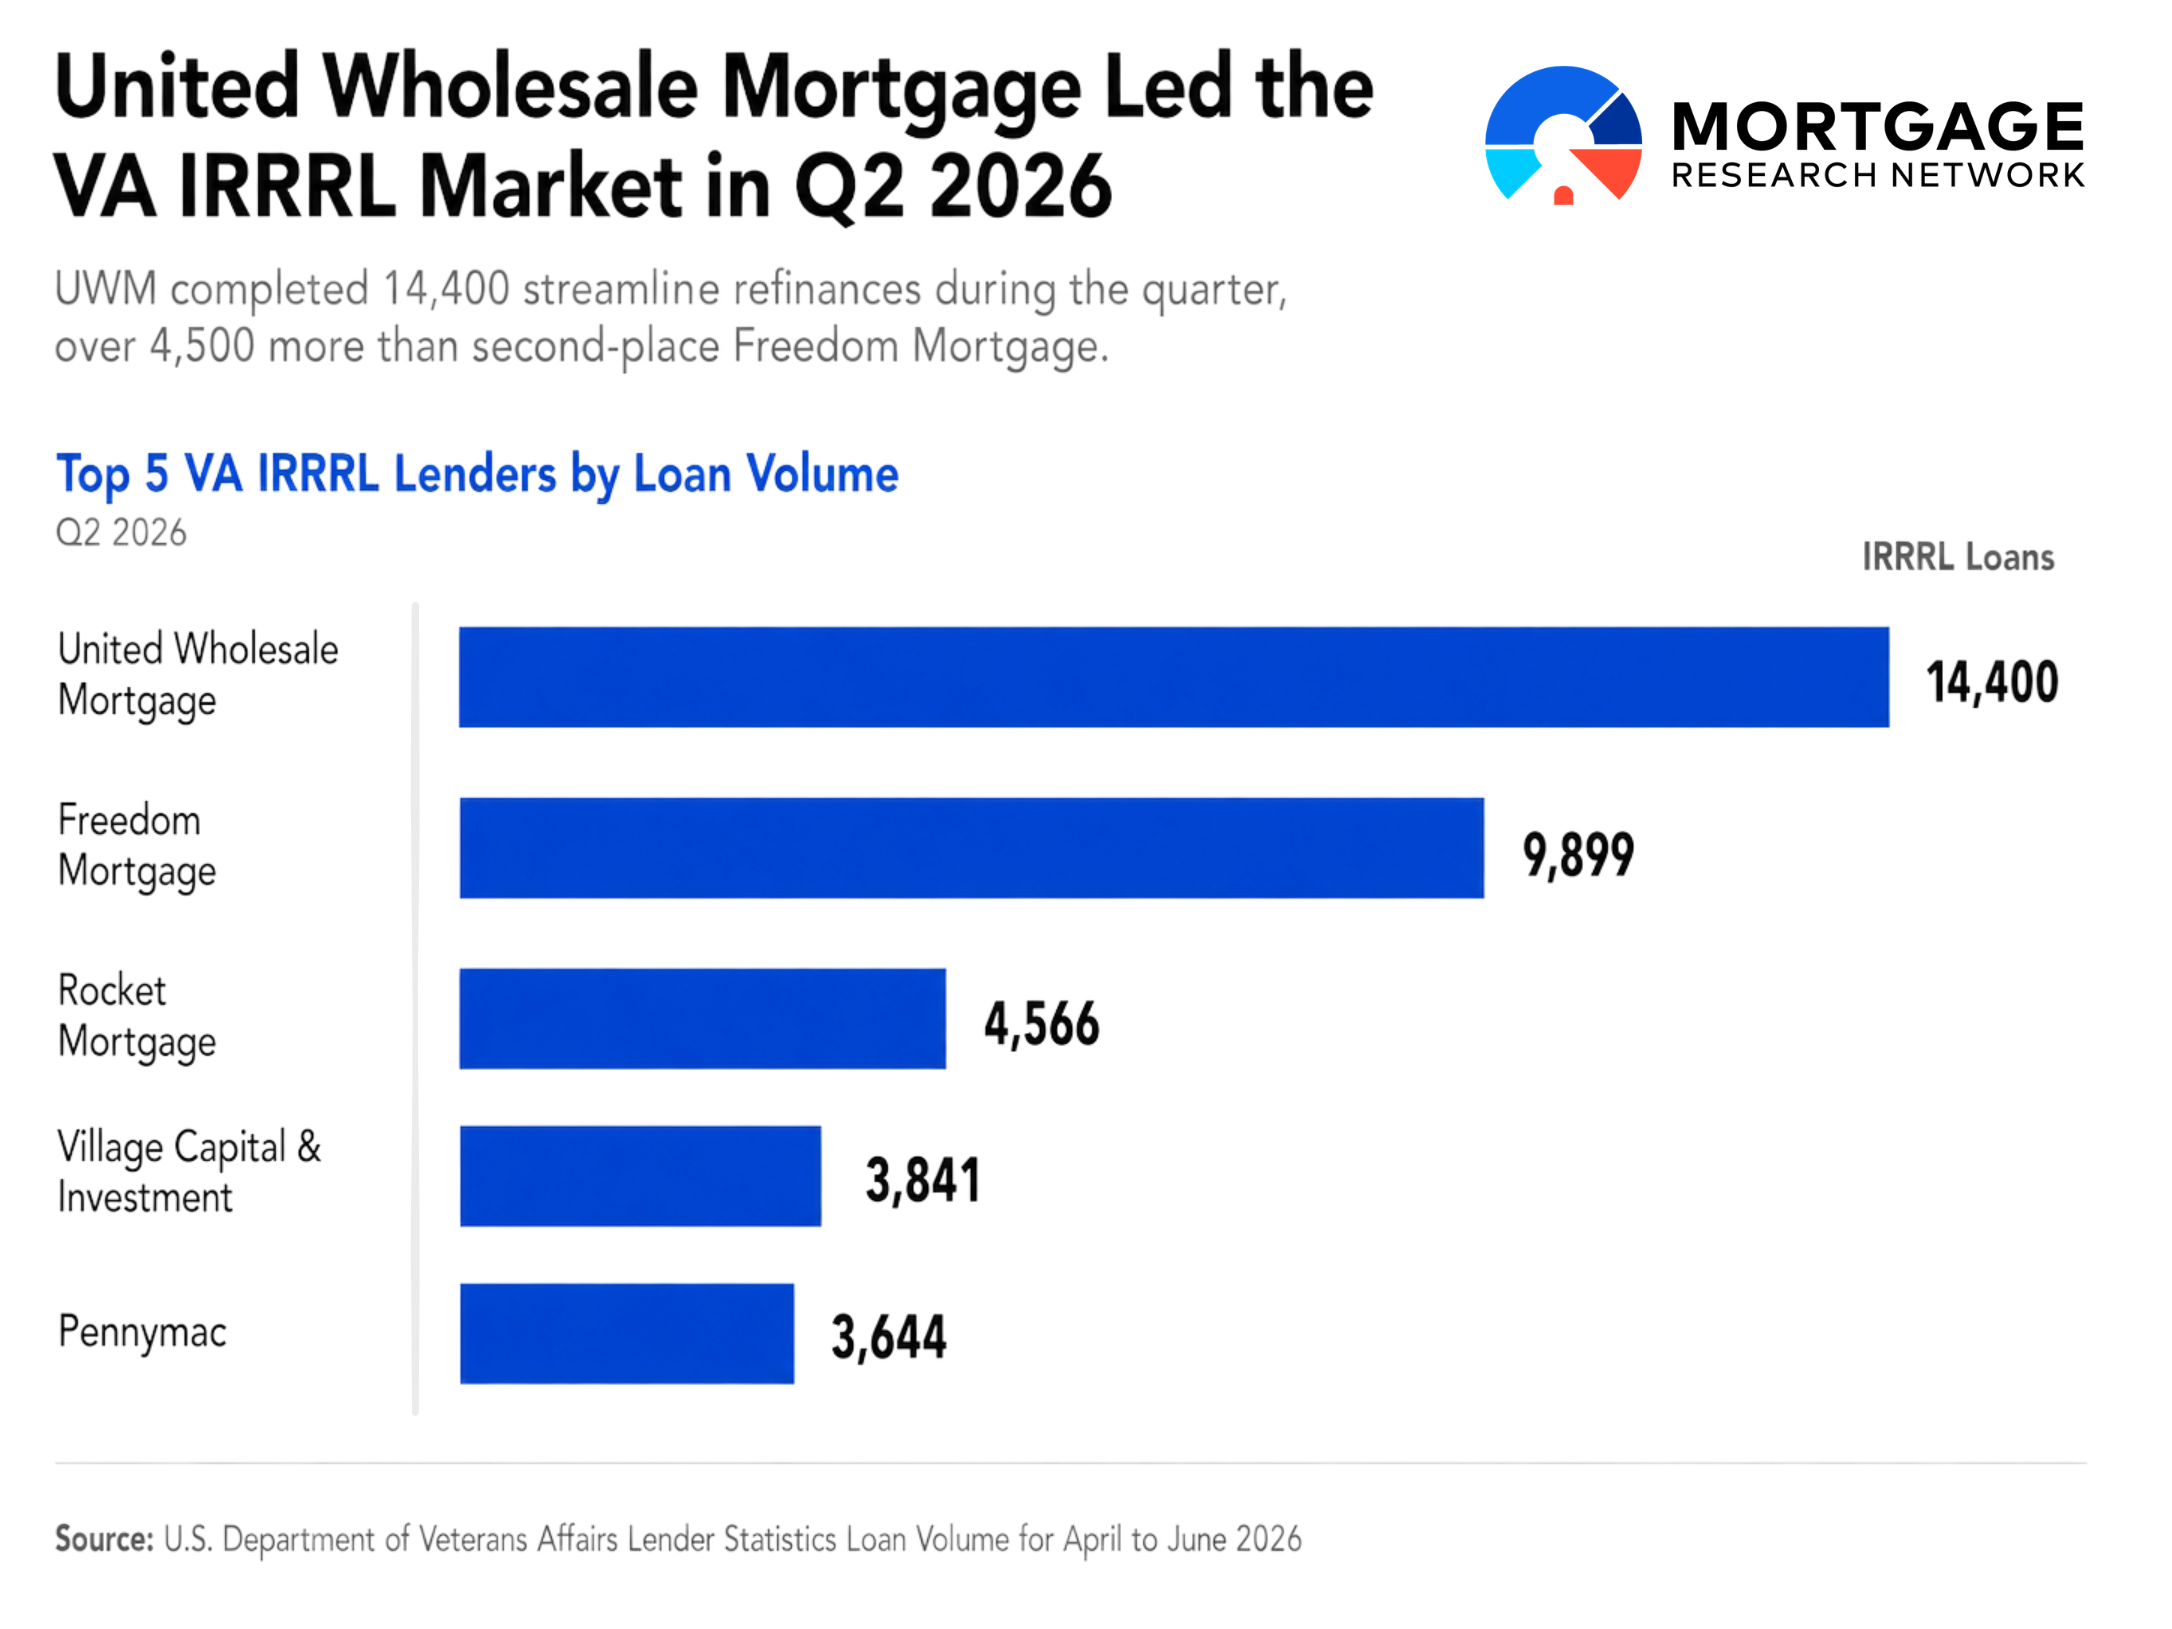
United Wholesale Mortgage was the largest VA Interest Rate Reduction Refinance Loan (IRRRL) lender for the period, completing 14,400 IRRRLs during the second quarter – 25.5% of all VA streamline refinances.
Freedom Mortgage ranked second with 9,899 loans and 17.6% of the market share. Together, UWM and Freedom originated 43.1% of Q2’s IRRRLs.
| Rank | Lender | Q2 2026 IRRRLs | Quarterly Change | Annual Change |
|---|---|---|---|---|
| 1 | United Wholesale Mortgage | 14,400 | -4.00% | 116.50% |
| 2 | Freedom Mortgage | 9,899 | -5.10% | 114.10% |
| 3 | Rocket Mortgage | 4,566 | -2.30% | 125.70% |
| 4 | Village Capital & Investment | 3,841 | 9.00% | 76.10% |
| 5 | Pennymac | 3,644 | -22.00% | 112.70% |
| 6 | Newrez | 2,271 | -20.10% | 86.00% |
| 7 | Veterans United Home Loans | 2,045 | -42.20% | -2.90% |
| 8 | Planet Home Lending | 1,724 | -5.30% | 196.70% |
| 9 | Lakeview Loan Servicing | 1,243 | -11.10% | 82.30% |
| 10 | Navy Federal Credit Union | 1,210 | 47.20% | 250.70% |
Four of the five largest Q2 IRRRL lenders completed fewer streamline refinances than during Q1. Village Capital was the exception, increasing 9.0%.
Pennymac recorded the largest quarterly decline among the top five, falling 22.0%.
Navy Federal, ranked tenth for the period, moved sharply in the opposite direction, representing the largest quarterly and annual gains. Its IRRRL volume increased 47.2% compared to Q1 and more than tripled from a year earlier.
Overall, the IRRRL market was highly concentrated, with the five largest lenders accounting for 64.5% of interest rate reduction refinance loans. Adding in the rest of the top 10 brings that figure up to 79.5%.
Q2 Saw Rates Rise, Likely Explaining the Quarterly IRRRL Decline
IRRRL originations totaled 56,386 during the second quarter, which represents an 11.4% decline from Q1. However, this total is an impressive 93.2% higher than Q2 2025.
These changes may well be explained by the overall trends we’ve seen in mortgage rates both this year, and compared to last.
According to the Optimal Blue 30-Year Fixed Rate Veterans Affairs Mortgage Index, available through the Federal Reserve, VA loan rates averaged:
6.37% during Q2 2025
5.74% during Q1 2026
6.01% during Q2 2026
Rates were approximately 27 basis points higher in Q2 than in Q1. This would tend to reduce the number of borrowers who could meet VA Net Tangible Benefit guidelines and lower their rate or payment with an IRRRL.
At the same time, Q2 rates remained around 36 basis points lower than a year earlier. Despite the recent rise, we still have a lower rate environment than during the second quarter of 2025, helping explain why year-over-year IRRRL volume nearly doubled.
At the state level, Texas reported the most IRRRLs, with 5,607. Florida again ranked second with 4,447.
By county, Maricopa County, Arizona, led with 790 VA streamline refinances, followed by San Diego County, California, with 625, and El Paso County, Colorado, with 604.
Largest VA Cash-Out Refinance Lenders
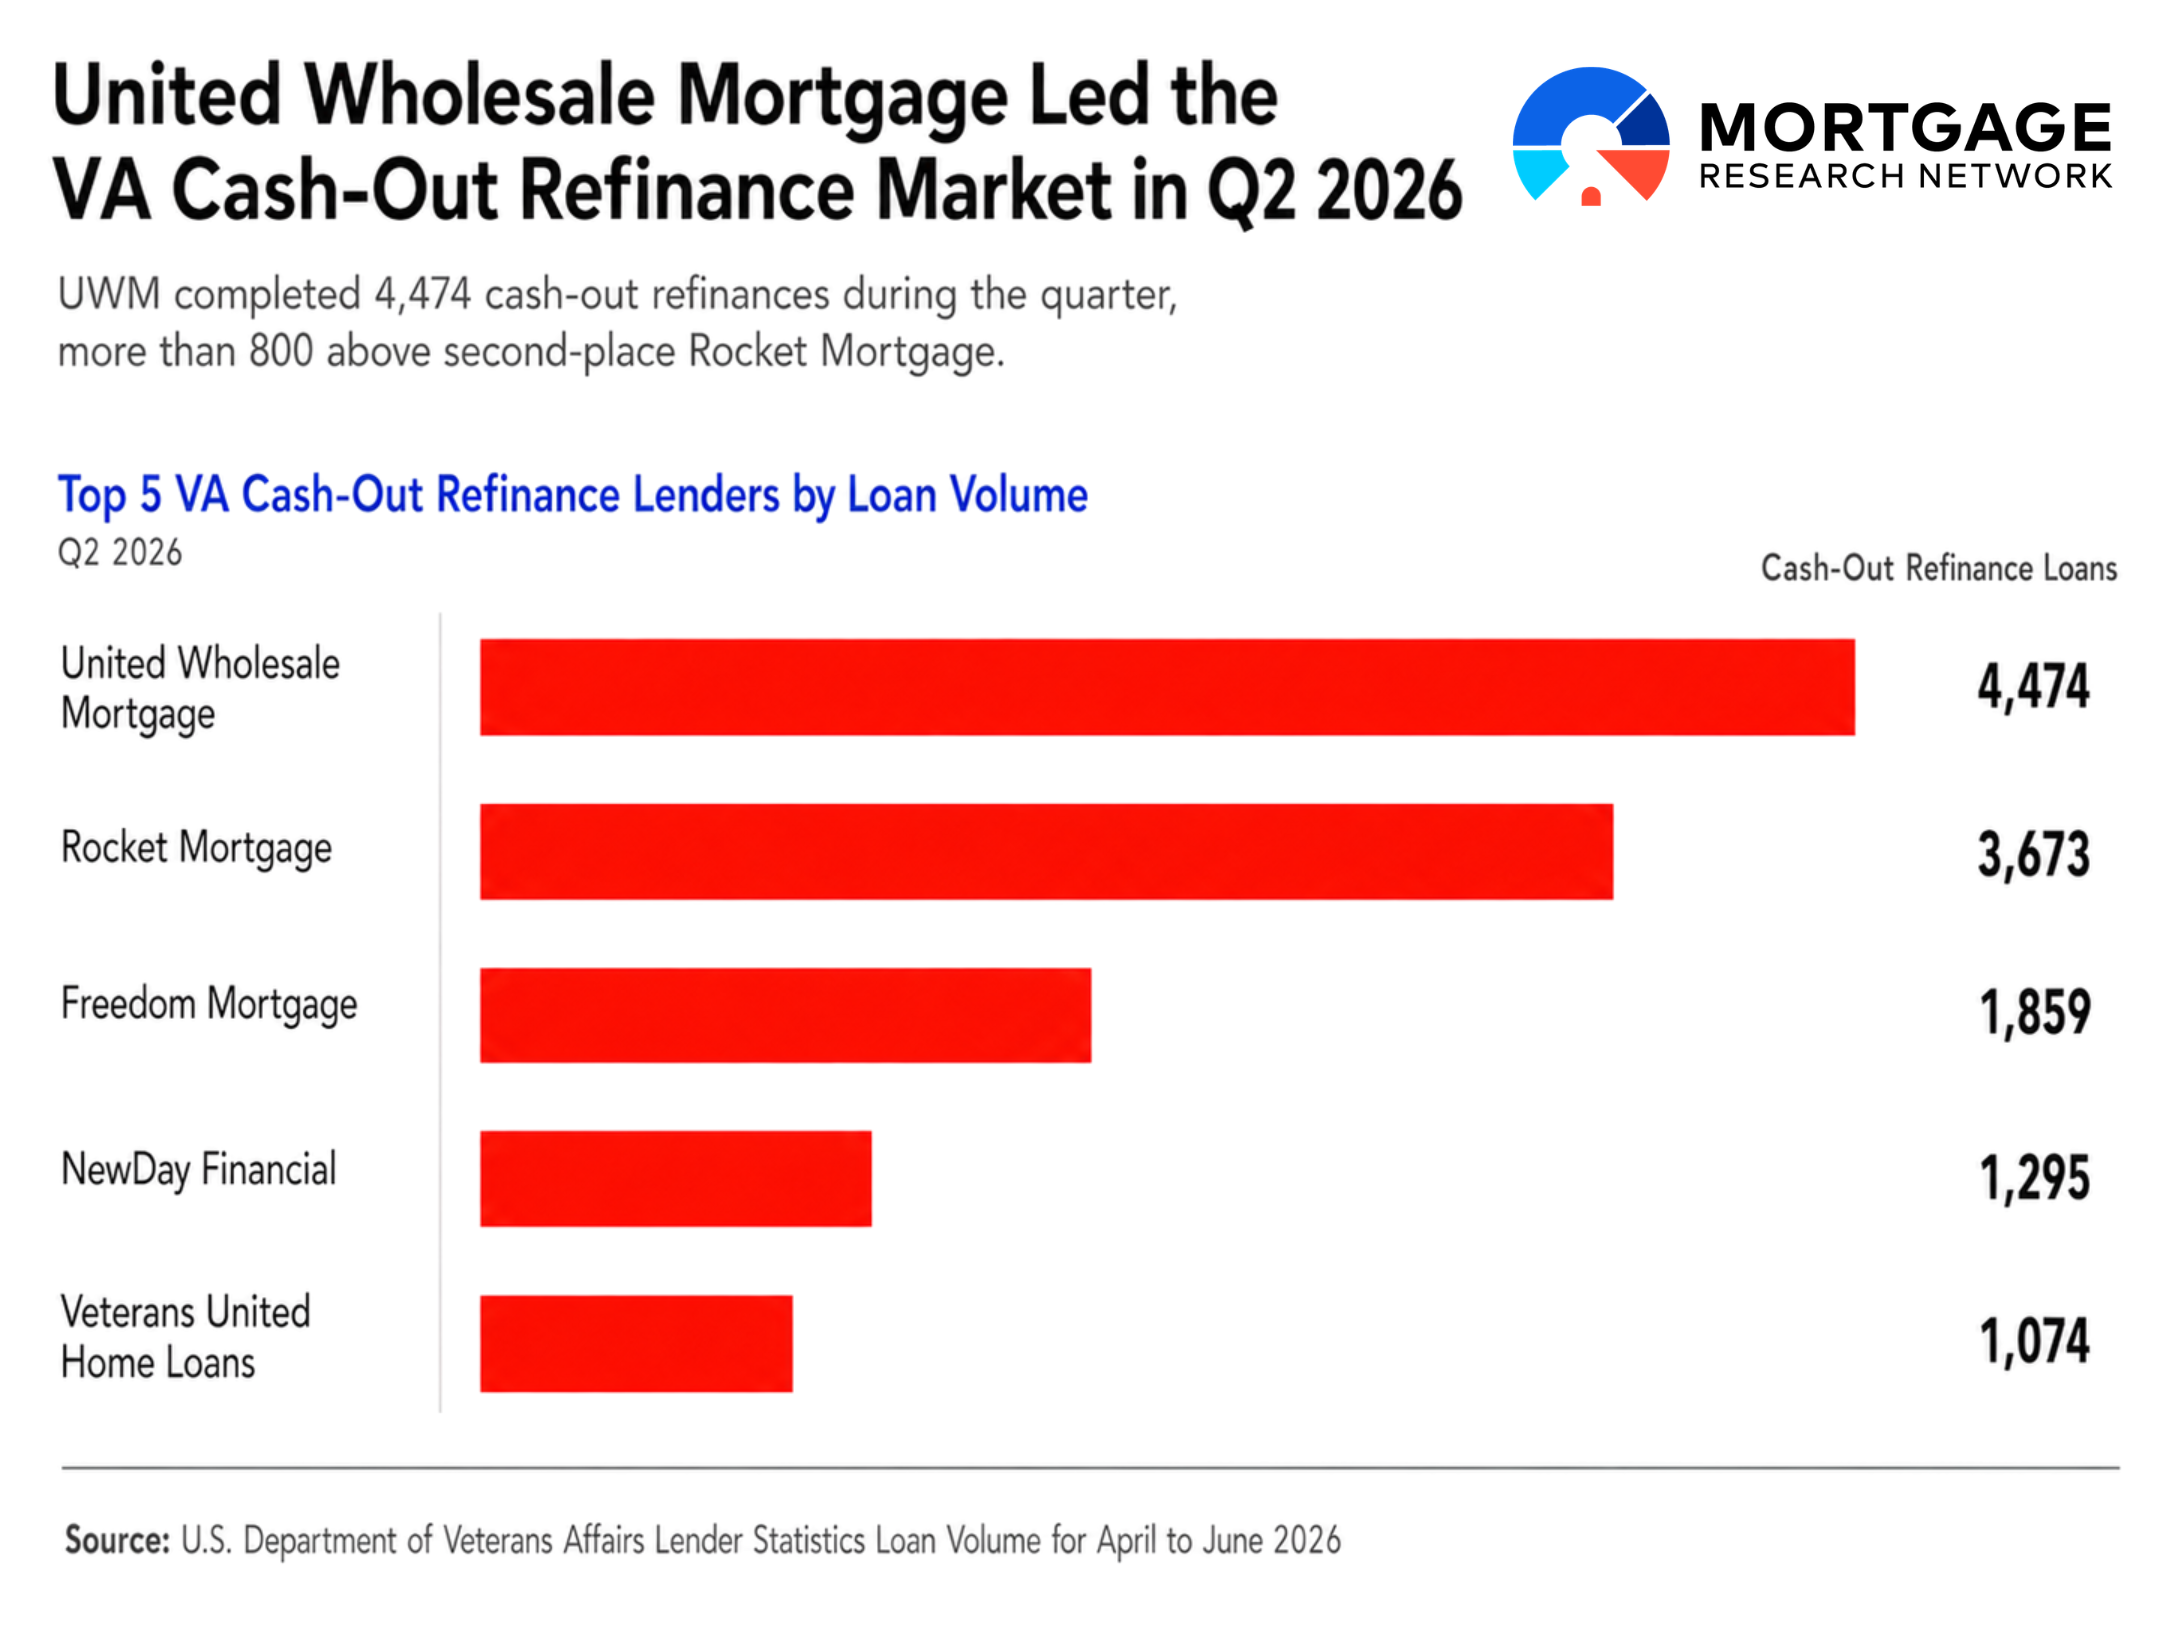
UWM also ranked first for VA cash-out refinances, originating 4,474 loans. This represents a 26% increase from Q1 and a 60.8% annual rise.
Rocket Mortgage followed with 3,673 cash-out refinances, up 17.8% and 16.9%, respectively. These two lenders combined accounted for nearly one-third of the category’s market share.
| Rank | Lender | Q2 2026 Cash-Out Loans | Quarterly Change | Annual Change |
|---|---|---|---|---|
| 1 | United Wholesale Mortgage | 4,474 | 26.00% | 60.80% |
| 2 | Rocket Mortgage | 3,673 | 17.80% | 16.90% |
| 3 | Freedom Mortgage | 1,859 | 1.50% | 24.80% |
| 4 | NewDay Financial | 1,295 | 7.40% | -14.10% |
| 5 | Veterans United Home Loans | 1,074 | 0.40% | 34.40% |
| 6 | Equity Prime Mortgage | 1,036 | 629.60% | 116.70% |
| 7 | Village Capital & Investment | 859 | -16.90% | 1.70% |
| 8 | LoanDepot | 822 | 6.60% | 3.10% |
| 9 | Navy Federal Credit Union | 804 | 4.60% | 75.20% |
| 10 | The Federal Savings Bank | 685 | 13.00% | -15.10% |
NewDay Financial and The Federal Savings Bank were the only two of the top 10 cash-out refinance lenders to report year-over-year declines, down 14.1% and 15.1%, respectively.
While 9 out of 10 ranked lenders showed a quarterly increase, the largest jump came from Equity Prime Mortgage. The company increased its cash-out originations from 142 in Q1 to 1,036 in Q2 – a nearly 630% rise.
In total, the five largest cash-out lenders represented 49.7% of the quarter’s market share, with the top 10 accounting for 66.6%, or roughly two-thirds.
Cash-Out Refinances Increased Despite Higher Rates
The Department of Veterans Affairs guaranteed 24,892 cash-out refinances during Q2, which was up 7.9% from Q1 and 22.1% annually.
While IRRRLs fell between Q1 and Q2, cash-out loans increased, likely because cash-out activity is not as dependent on rates. Borrowers may be willing to accept a higher interest rate in exchange for being able to access their equity for reasons like debt consolidation or home improvement needs.
At the same time, homeowners refinancing into the VA mortgage program from another loan type would do so with a cash-out refinance. As VA loans tend to have some of the lowest rates on the market, this could be another reason for the rise.
Florida accounted for the most cash-out transactions, with 2,129, followed by North Carolina, with 1,460, and Georgia, a close third, with 1,455.
For counties, the leaders were:
Maricopa County, Arizona – 341
Clark County, Nevada – 237
San Diego County, California – 230
Largest VA Lenders Across All Loan Types
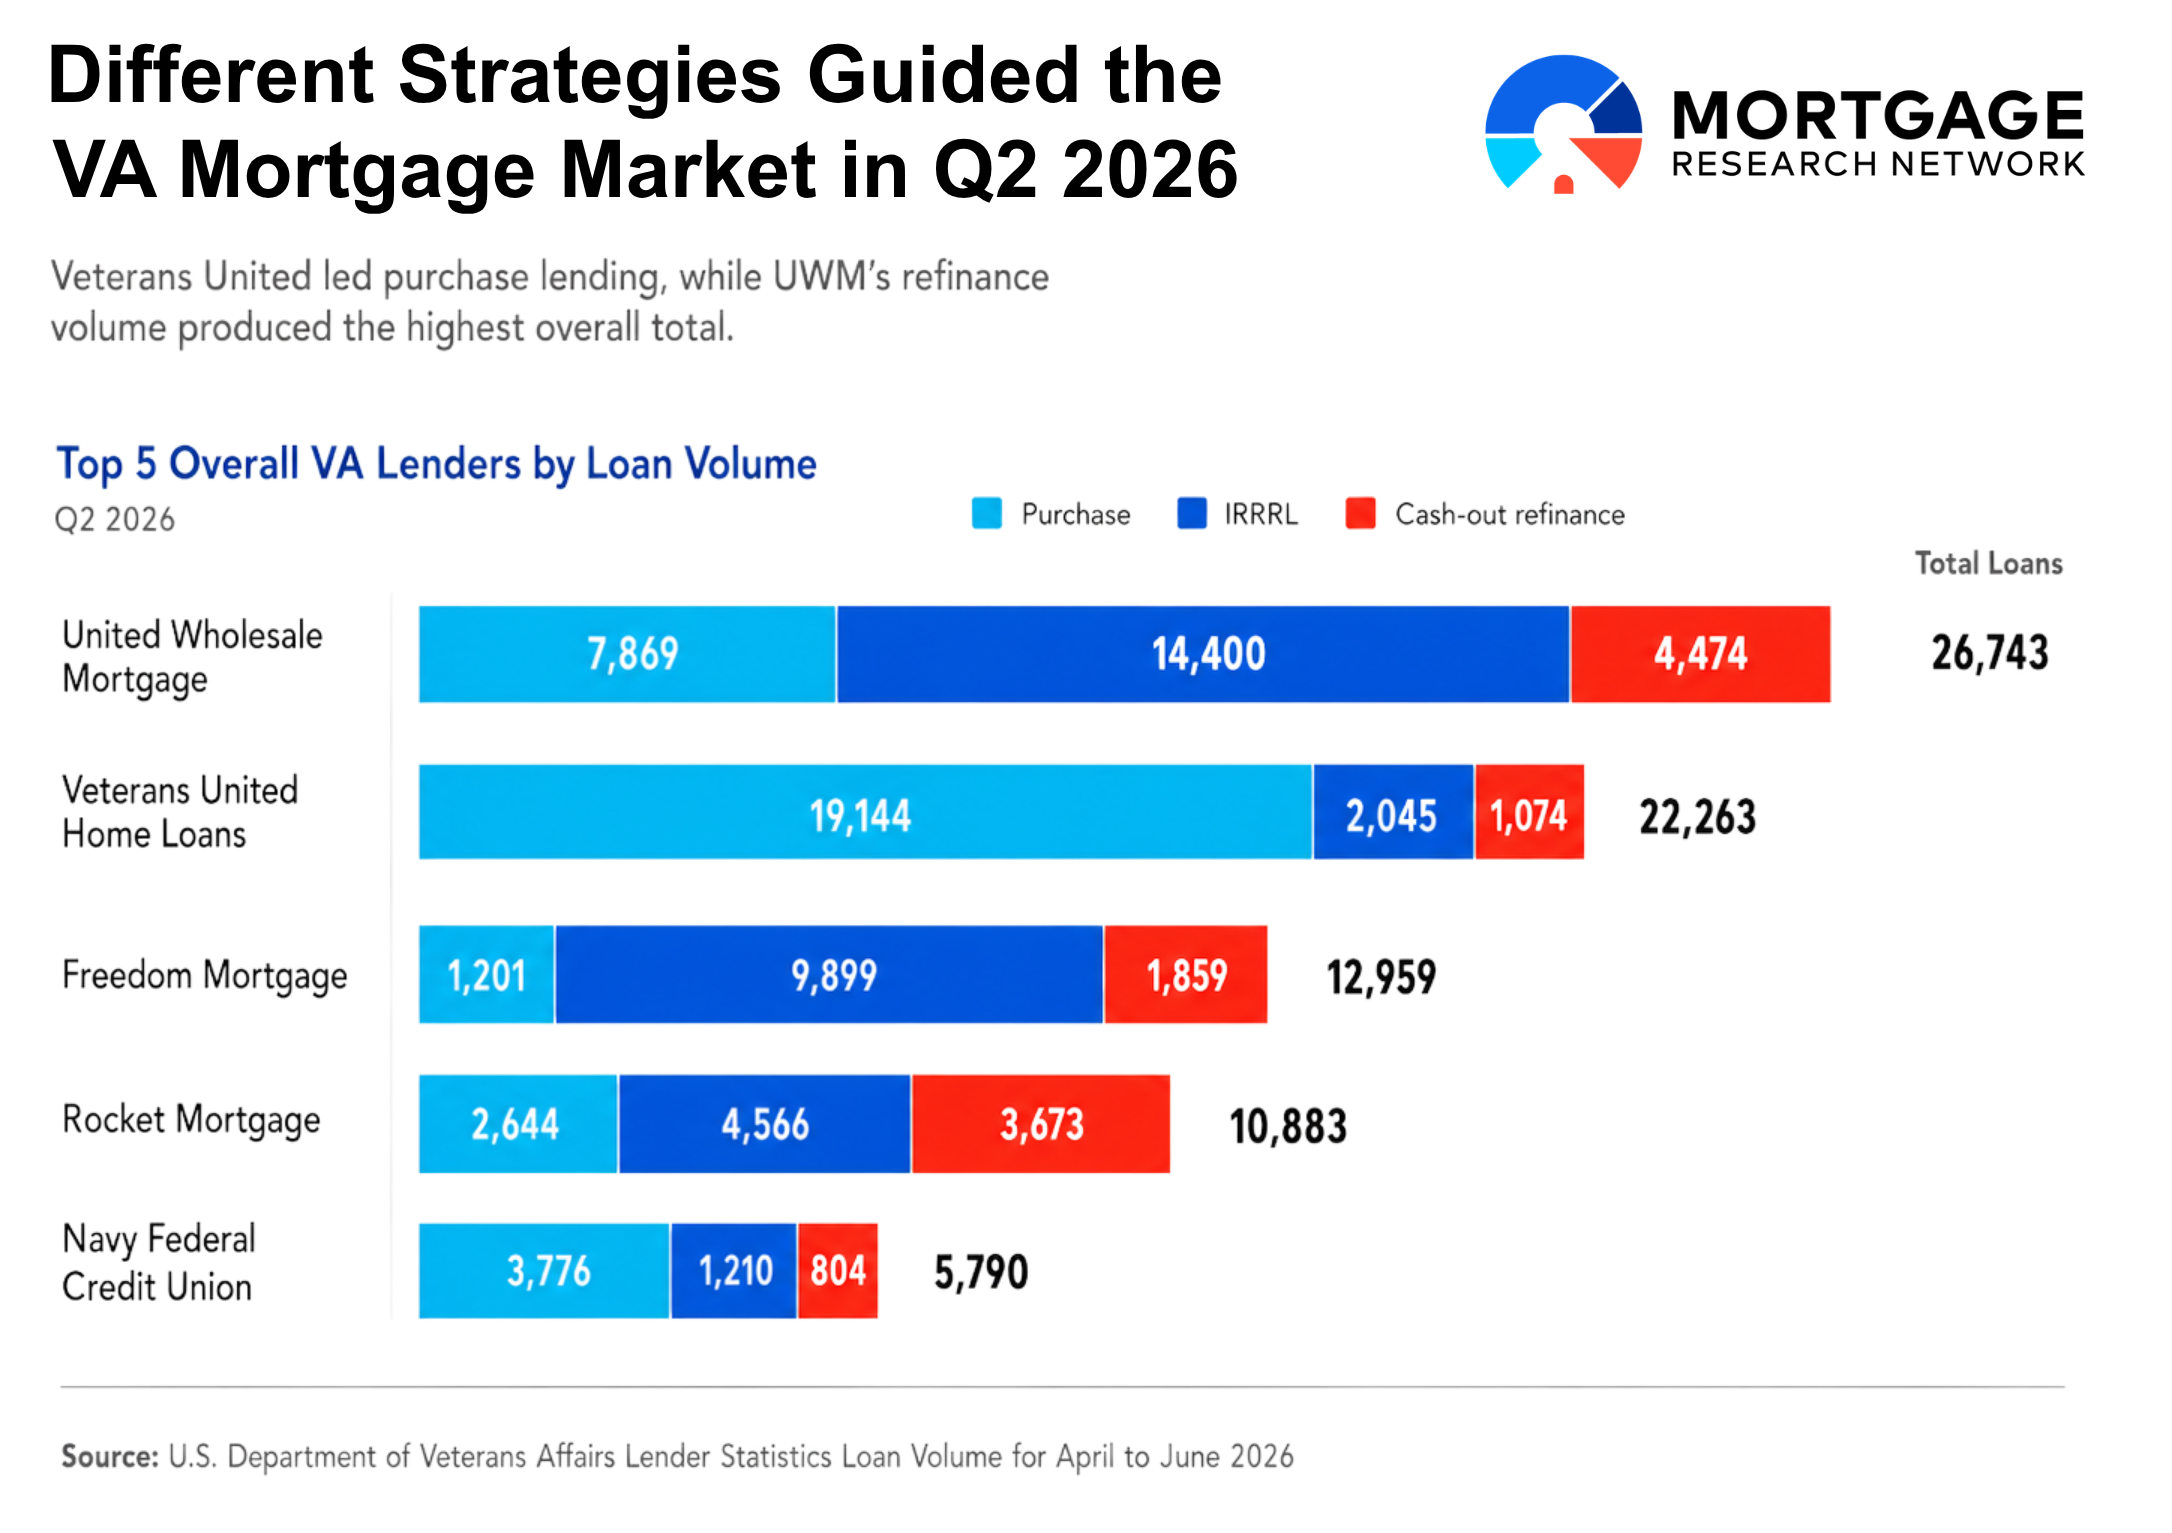
Combining purchase loans, IRRRLs, and cash-out refinances, United Wholesale Mortgage was the largest VA lender during Q2 2026.
UWM originated 26,743 total loans, representing 15.3% of the overall volume.
Veterans United ranked second with 22,263 loans completed and a 12.8% market share.
| Rank | Lender | Q2 2026 Total Loans | Quarterly Change | Annual Change |
|---|---|---|---|---|
| 1 | United Wholesale Mortgage | 26,743 | 11.70% | 89.70% |
| 2 | Veterans United Home Loans | 22,263 | 18.50% | 12.50% |
| 3 | Freedom Mortgage | 12,959 | -0.60% | 81.40% |
| 4 | Rocket Mortgage | 10,883 | 15.80% | 44.40% |
| 5 | Navy Federal Credit Union | 5,790 | 23.30% | 32.20% |
| 6 | Pennymac | 5,089 | -19.80% | 43.60% |
| 7 | Village Capital & Investment | 5,020 | 5.40% | 56.90% |
| 8 | CrossCountry Mortgage | 4,225 | 11.70% | 55.70% |
| 9 | Newrez | 3,557 | -19.00% | 41.70% |
| 10 | DHI Mortgage | 3,196 | 35.80% | 4.90% |
UWM’s overall lead was primarily the result of its refinancing business. The lender originated 14,400 IRRRLs and 4,474 cash-out loans, for a combined 18,874 refinances – 70.6% of its Q2 VA loan volume.
Veterans United took a much different approach. Purchases represented 86.0% of its total VA lending figures.
Freedom Mortgage, which ranked third overall, was also heavily refinance-focused. IRRRLs accounted for 76.4% of its loan numbers for the period.
In fourth, Rocket Mortgage, the final lender to issue more than 10,000 VA loans, had a more balanced mix: 42.0% of its volume came from IRRRLs, 33.7% from cash-out refinances, and 24.3% from purchases.
Overall VA Loan Volume Increased 29% Annually
The VA insured 174,514 loans during Q2 2026, compared to 157,100 loans in Q1 and 135,230 in Q2 2025.
Those figures represent growth of:
11.1% for the quarter
29.0% year over year
However, different loan types drove the quarterly and annual increases.
The quarter-over-quarter gain came primarily from purchase lending. VA purchase loan volume increased by 22,855 compared to Q1, while cash-out refinances added another 1,818 to the total. IRRRL numbers declined by 7,259.
On the other hand, the annual increase was driven largely by IRRRL activity. VA lenders completed 27,207 more IRRRLs than in Q2 2025, accounting for around 69% of the 39,284-loan annual increase. Purchase loans added 7,565 transactions, while cash-out refinances contributed another 4,512.