



In 2025, mortgage lenders originated about 93,000 loans for second homes in the U.S. — a 3.9% year-over-year gain — according to the most recent Home Mortgage Disclosure Act (HMDA) data.
You’ll find some of the ritziest U.S. cities atop the list for highest number of secondary residences. However, many smaller, less expensive, and even surprising housing markets also made the cut.
See where people bought the most vacation homes in the last year and which places saw the biggest changes from 2024.
Top 25 Metropolitan Areas for Secondary Residences in 2025
To find which metropolitan statistical areas (MSAs) boast the most second homes, MortgageResearch.com analyzed the latest HMDA data for 2025 using Polygon Research's HMDAVision. A total of 3,095 lenders originated 92,939 purchase loans for 1-unit secondary residences, with a median property value of $495,000 and a median borrower income of $255,000.
Since buying a second home typically means having a lot of extra capital, some of the country’s priciest real estate locales led the charge. The bright lights of New York City are a big draw for secondary dwellings, as the Big Apple accounted for 2,706 purchase originations and a 2.91% share of the market. New York claimed the no. 1 spot for the fourth straight year.
With its proximity to resorts and rising popularity among snowbirds, Phoenix came next with 2,108 and a 2.27% market share (the only other metro area above 2K and 2%). Rounding out the top five were Miami (1,704 and 1.83%), North Port, Fla. (1,554 and 1.67%), and Riverside, Calif. (1,516 and 1.63%). Nearly a third, or 29,886, of all second-home originations came outside of defined metropolitan statistical areas (MSAs).
Among 2025’s top 25 MSAs, the largest annual jumps in volume happened in New York (261 more originations over 2024), Wildwood, Fla. (+203), and Phoenix (+201). Meanwhile, Las Vegas fell furthest with a decline of 199 originations, surpassing yearly drops of 179 in Tampa, Fla., and 152 in Orlando, Fla.
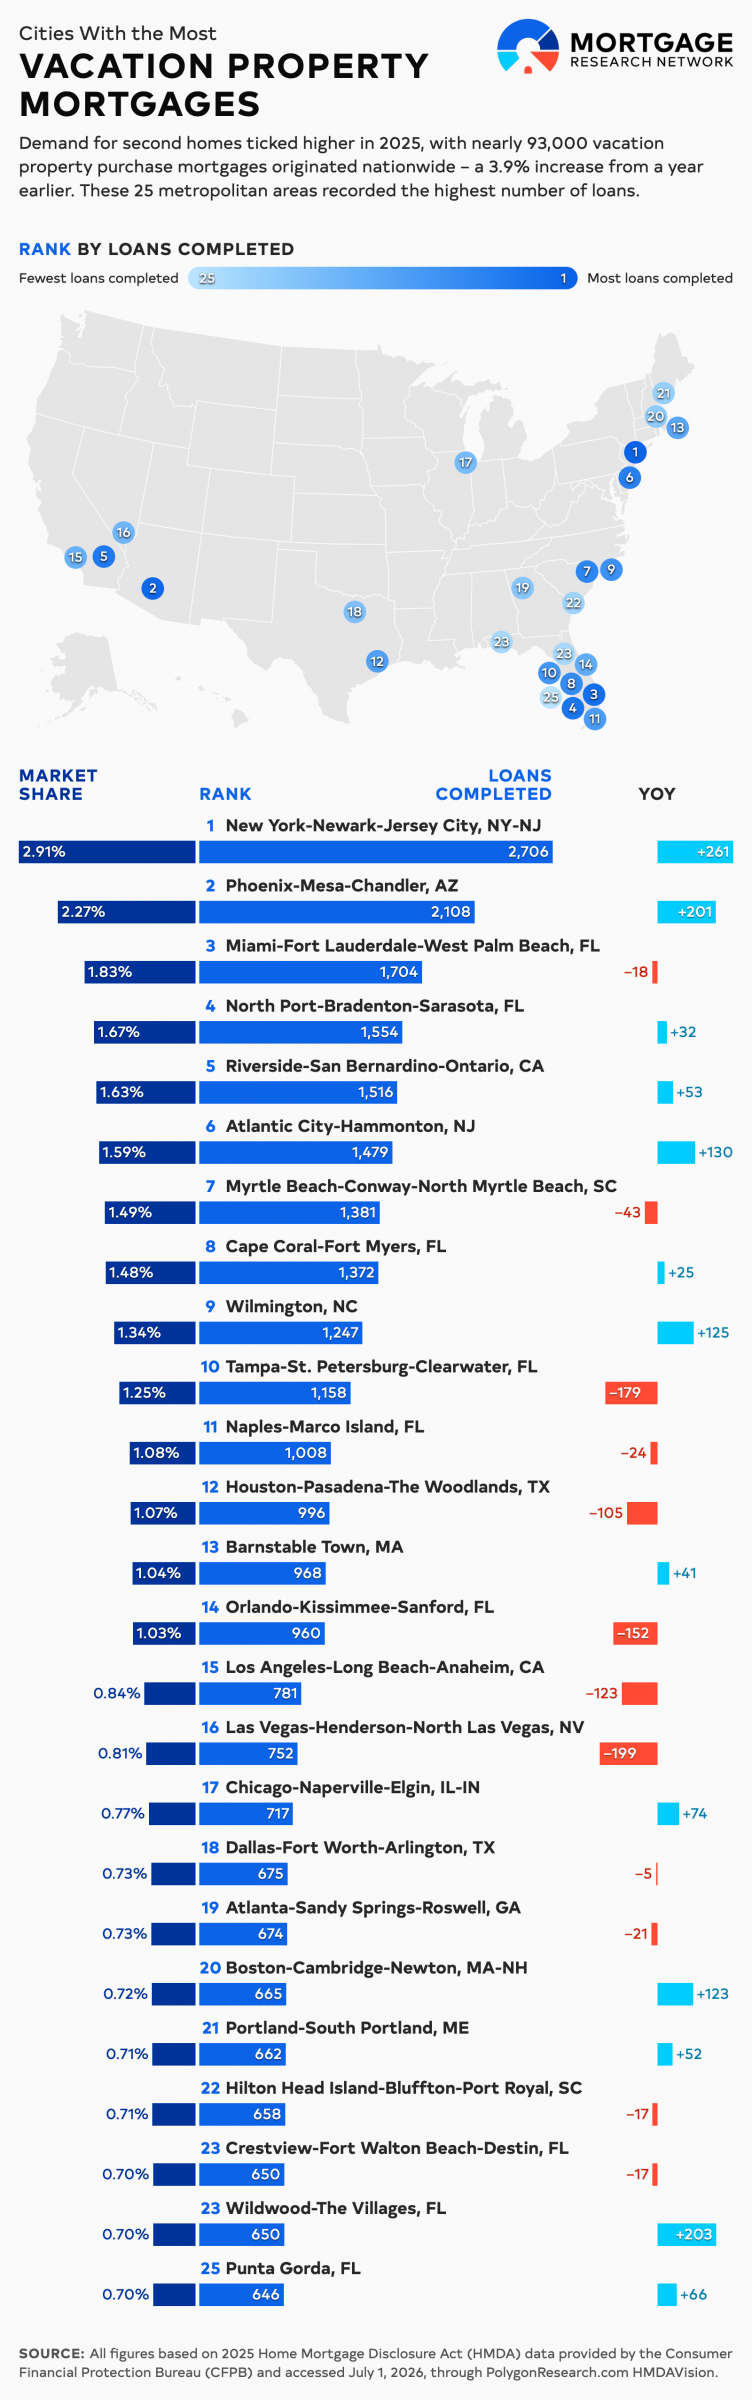
The table below shows second-home purchase data by MSA, ranked by 2025 originations.
| 2025 Rank | Metropolitan Statistical Area | Originations | Market Share | YoY Origination Delta |
|---|---|---|---|---|
| 1 | New York-Newark-Jersey City, NY-NJ | 2,706 | 2.91% | 261 |
| 2 | Phoenix-Mesa-Chandler, AZ | 2,108 | 2.27% | 201 |
| 3 | Miami-Fort Lauderdale-West Palm Beach, FL | 1,704 | 1.83% | -18 |
| 4 | North Port-Bradenton-Sarasota, FL | 1,554 | 1.67% | 32 |
| 5 | Riverside-San Bernardino-Ontario, CA | 1,516 | 1.63% | 53 |
| 6 | Atlantic City-Hammonton, NJ | 1,479 | 1.59% | 130 |
| 7 | Myrtle Beach-Conway-North Myrtle Beach, SC | 1,381 | 1.49% | -43 |
| 8 | Cape Coral-Fort Myers, FL | 1,372 | 1.48% | 25 |
| 9 | Wilmington, NC | 1,247 | 1.34% | 125 |
| 10 | Tampa-St. Petersburg-Clearwater, FL | 1,158 | 1.25% | -179 |
| 11 | Naples-Marco Island, FL | 1,008 | 1.08% | -24 |
| 12 | Houston-Pasadena-The Woodlands, TX | 996 | 1.07% | -105 |
| 13 | Barnstable Town, MA | 968 | 1.04% | 41 |
| 14 | Orlando-Kissimmee-Sanford, FL | 960 | 1.03% | -152 |
| 15 | Los Angeles-Long Beach-Anaheim, CA | 781 | 0.84% | -123 |
| 16 | Las Vegas-Henderson-North Las Vegas, NV | 752 | 0.81% | -199 |
| 17 | Chicago-Naperville-Elgin, IL-IN | 717 | 0.77% | 74 |
| 18 | Dallas-Fort Worth-Arlington, TX | 675 | 0.73% | -5 |
| 19 | Atlanta-Sandy Springs-Roswell, GA | 674 | 0.73% | -21 |
| 20 | Boston-Cambridge-Newton, MA-NH | 665 | 0.72% | 123 |
| 21 | Portland-South Portland, ME | 662 | 0.71% | 52 |
| 22 | Hilton Head Island-Bluffton-Port Royal, SC | 658 | 0.71% | -17 |
| 23 | Crestview-Fort Walton Beach-Destin, FL | 650 | 0.70% | -17 |
| 23 | Wildwood-The Villages, FL | 650 | 0.70% | 203 |
| 25 | Punta Gorda, FL | 646 | 0.70% | 66 |
Secondary Residence Mortgage Trends
The last five years of available data showed second home purchases cratered from earlier in the decade, coinciding with a double-whammy of higher interest rates plus Fannie Mae’s dramatic rate and fee increases for second homes beginning in April 2022. This sweeping move made second home mortgages every bit as expensive as those for investment properties.
However, originations most recently swung back modestly as home price growth slowed and mortgage rates descended gradually.
The median property value on secondary residences rose 25.3% from $395,000 in 2021 to $495,000 in 2025. Meanwhile, median applicant income jumped 40.1% from $182,000 to $255,000 over that five-year window. With median incomes increasing at a faster pace than median values, that relationship may suggest that it’s taking a higher level of wealth to purchase a second home than it previously did. This correlation would align with the strained affordability defining the overall housing market.
The table below shows a year-by-year analysis of 1-unit purchase originations for secondary residences from 2021 to 2025:
| Year | Second-Home Purchase Originations | YoY Growth | Median Property Value | Median Borrower Income |
|---|---|---|---|---|
| 2025 | 92,939 | 3.90% | $495,000 | $255,000 |
| 2024 | 89,447 | -4.61% | $485,000 | $246,500 |
| 2023 | 93,767 | -39.24% | $465,000 | $238,000 |
| 2022 | 154,326 | -41.85% | $455,000 | $210,000 |
| 2021 | 265,380 | - | $395,000 | $182,000 |
Top Lenders for Second Homes
For secondary properties, your choice of mortgage narrows. Generally, you’ll need to qualify for a conventional loan: USDA loans are only permitted for primary residences, while mortgages backed by the Department of Veterans Affairs (VA) and Federal Housing Administration (FHA) allow for very special exceptions (assuming the existing mortgage, if allowed; or converting your primary mortgage to a secondary upon the new purchase).
Out of the 92,939 second-home purchase mortgages in 2025, a staggering 92,838 (99.89%) used a conventional loan. The remaining 101 were split 75 (0.08%) VA and 26 (0.03%) FHA.
As mentioned, interest rates and Fannie Mae-mandated loan fees for second homes are higher than the rates you’d qualify for on a primary residence since they inherently carry more risk.
It often makes sense to work with a lender that frequently originates the loan type you need. With better knowledge of the specific underwriting rules, their experience can prove beneficial and give you an advantage over other borrowers.

The table below shows the top 20 lenders for second homes ranked by 2025 purchase originations, according to Polygon Research's HMDAVision:
| 2025 Rank | Lender Name | Originations | Lender Market Share |
|---|---|---|---|
| 1 | United Wholesale Mortgage | 4,267 | 4.59% |
| 2 | Rocket Mortgage | 2,713 | 2.92% |
| 3 | JPMorgan Chase Bank | 2,424 | 2.61% |
| 4 | Crosscountry Mortgage | 2,017 | 2.17% |
| 5 | Wells Fargo Bank | 1,753 | 1.89% |
| 6 | Bank Of America | 1,670 | 1.80% |
| 7 | U.S. Bank | 1,566 | 1.68% |
| 8 | CMG Mortgage | 1,529 | 1.65% |
| 9 | Pennymac Loan Services | 1,421 | 1.53% |
| 10 | Morgan Stanley Private Bank | 1,237 | 1.33% |
| 11 | Movement Mortgage | 1,195 | 1.29% |
| 12 | Guaranteed Rate | 1,176 | 1.27% |
| 13 | Guild Mortgage Company | 1,172 | 1.26% |
| 14 | Fairway Independent Mortgage Corporation | 1,167 | 1.26% |
| 15 | The Loan Store | 1,155 | 1.24% |
| 16 | Lennar Mortgage | 1,062 | 1.14% |
| 17 | Navy Federal Credit Union | 1,048 | 1.13% |
| 18 | Citibank | 952 | 1.02% |
| 19 | LoanDepot | 796 | 0.86% |
| 20 | DHI Mortgage Company | 745 | 0.80% |
Choosing the Right Lender for Your Second Home
A loan officer with experience in second home lending can help you figure out your best financing options.
The lender may even offer better options than Fannie Mae or Freddie Mac can provide, such as in-house loan products that aren’t available elsewhere. Call around to a few lenders in popular vacation spots for options beyond Fannie and Freddie.
And even though you’re in the financial position to buy a vacation property, you should still shop around for mortgage rates and products in order to negotiate better terms.
When you’re ready, contact a local lender to begin.
All figures based on 2025 Home Mortgage Disclosure Act (HMDA) data provided by the Consumer Financial Protection Bureau (CFPB) and accessed July 1, 2026, through PolygonResearch.com HMDAVision.