



They can be a gamble on the future. They can also provide a pathway to locking in a below-market interest rate and stretching your homebuying budget.
Whether due to their role in 2008’s housing crash or a preference for certainty, many homebuyers won’t even consider an adjustable-rate mortgage (ARM). But during times of high rates and low affordability, more borrowers are willing to take on the risk. Plus, today’s ARMs come with stronger underwriting rules and limits on how much your rate can adjust — initially, subsequently, and in total — making them much safer than during the financial crisis.
Adjustable-Rate Mortgages and the Top 10 Lenders
When fixed rates run high, borrowers may increasingly decide it’s a good time to get an ARM. Homebuyers who take out an ARM bet that average rates will be lower when the loan’s initial fixed period ends. Or, they plan to refinance or move before then.
If you understand how adjustable-rate mortgages work, they can be a money-saving hack for buying a home. However, that potential savings comes at the cost of a little more groundwork since it’s not a ‘set-it-and-forget-it’ option like fixed-rate mortgages (FRM), and fewer lenders offer ARM financing.
To find the lenders leading this corner of the market, MortgageResearch.com analyzed the most recent HMDA data using Polygon Research's HMDAVision and found 1,698 lenders originated 256,763 owner-occupied adjustable-rate purchase mortgages of 1-4 unit properties in 2025. This compares to 4,406 lenders and 2.89 million originations for FRMs.
The ARM dataset had a median loan amount of $465,000 ($305,000 for FRMs); a median property value of $655,000 ($365,000); and a median borrower income of $189,000 ($109,000).
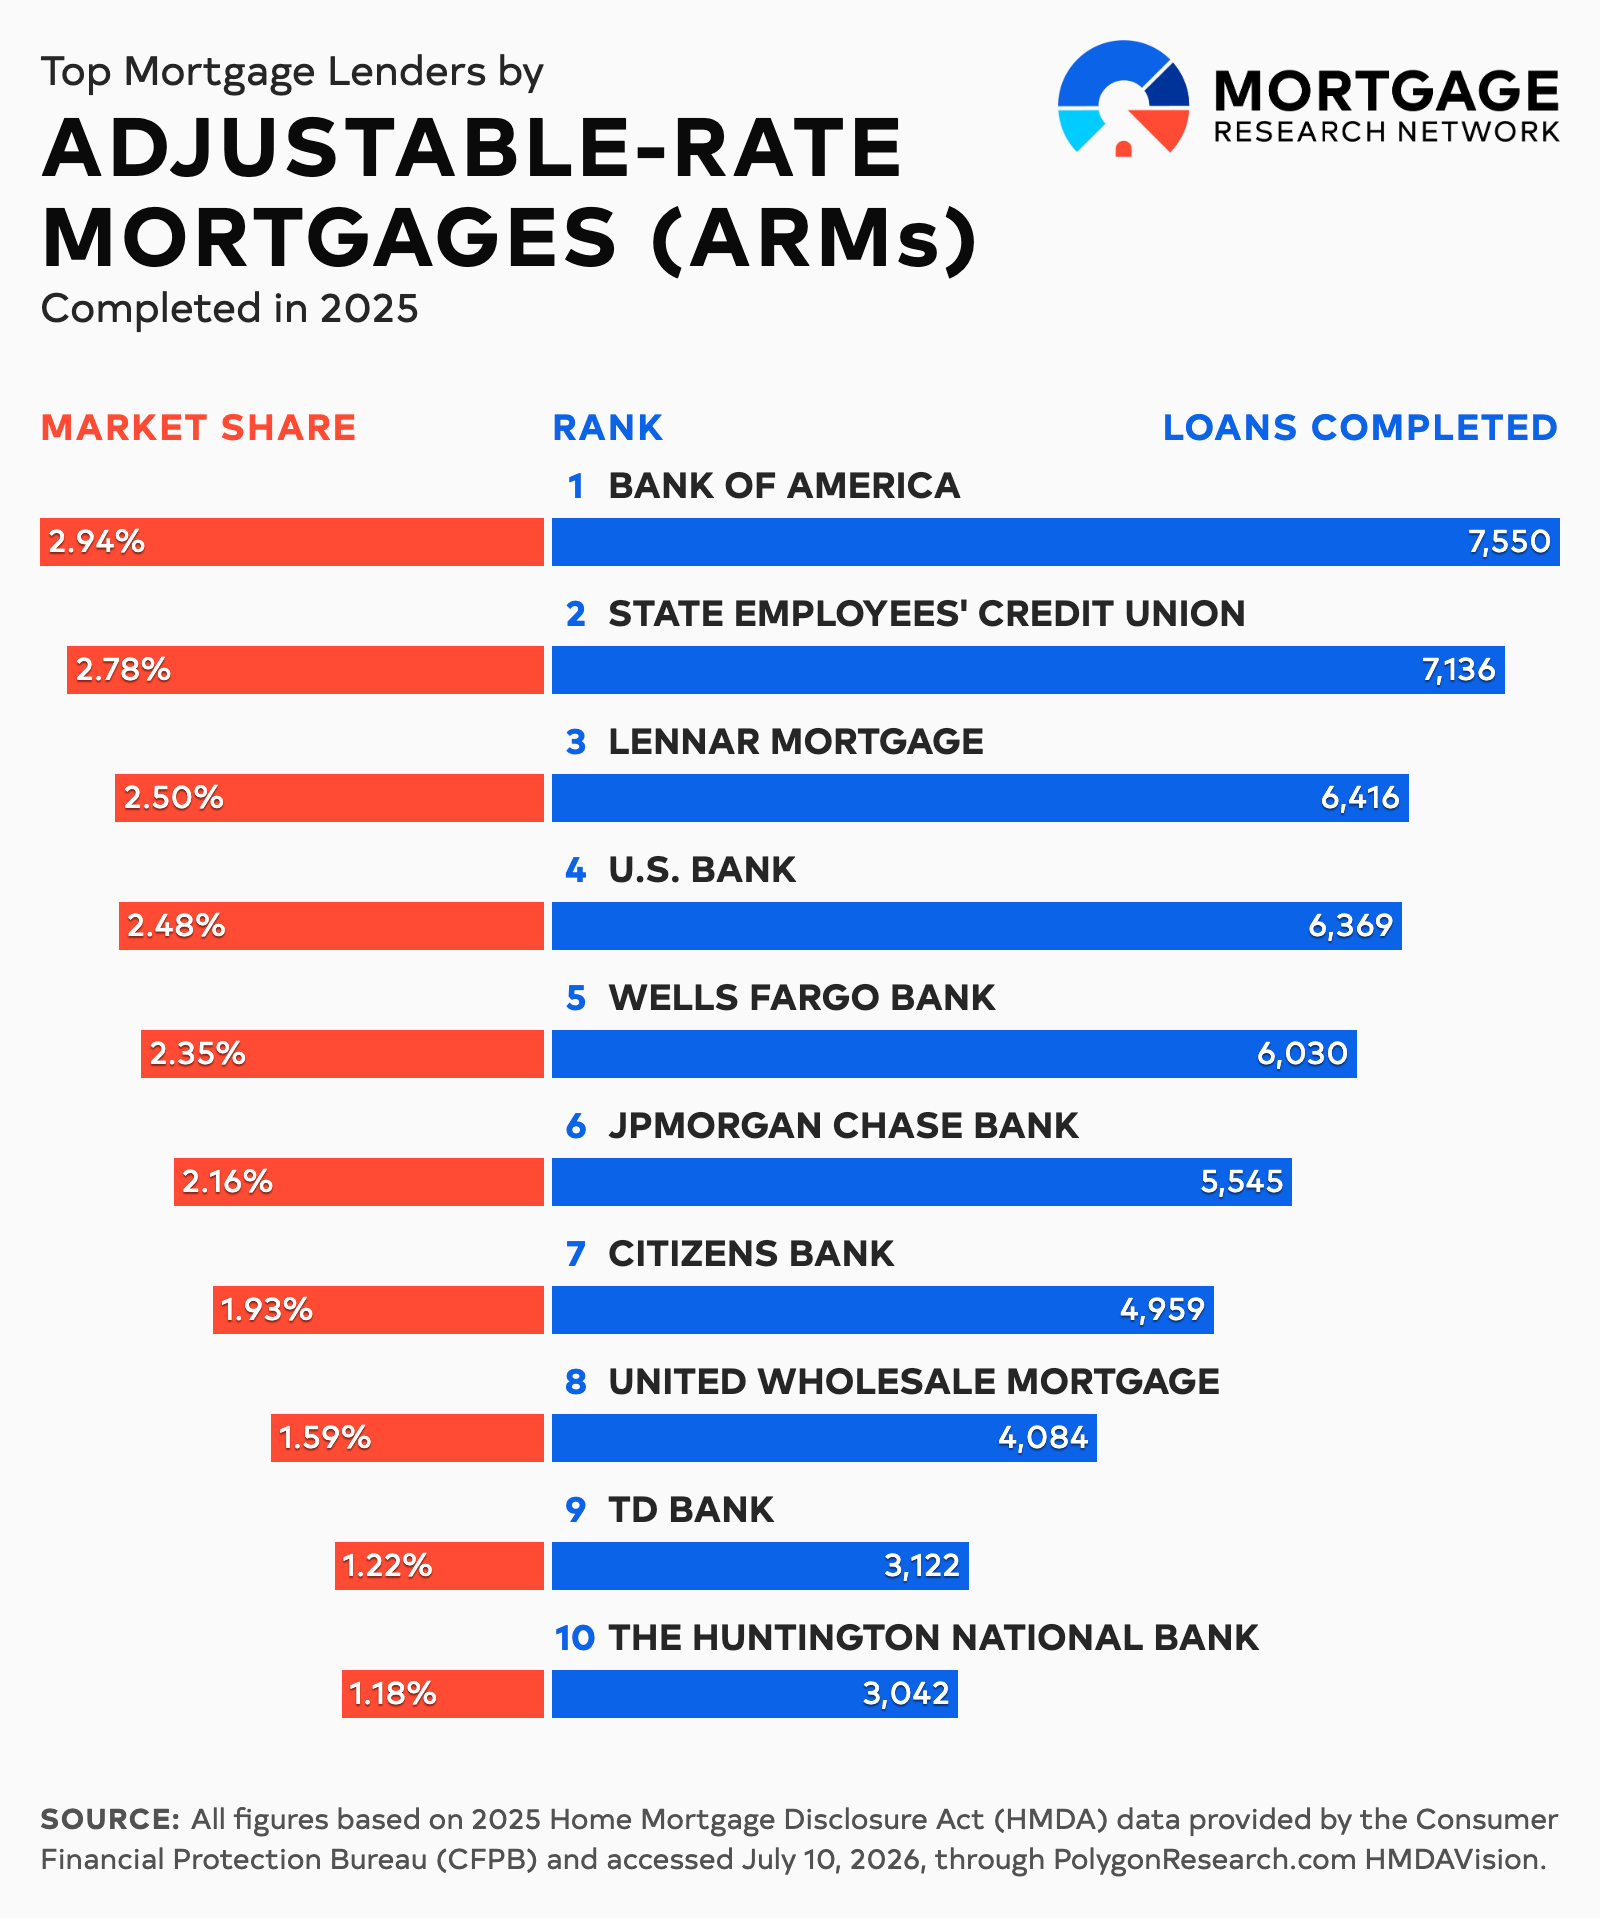
The year’s top 10 ARM lenders accounted for over a fifth (21.13%) of the volume, ranked by completed originations in the table below:
| 2025 Rank | Lender Name | 2025 Originations | 2025 Lender Market Share | 2024 Rank | 2024 Originations | 2024 Lender Market Share |
|---|---|---|---|---|---|---|
| 1 | Bank of America | 7,550 | 2.94% | 1 | 7,182 | 3.50% |
| 2 | State Employees’ Credit Union | 7,136 | 2.78% | 3 | 5,932 | 2.89% |
| 3 | Lennar Mortgage | 6,416 | 2.50% | 9 | 2,798 | 1.36% |
| 4 | U.S. Bank | 6,369 | 2.48% | 2 | 7,044 | 3.43% |
| 5 | Wells Fargo | 6,030 | 2.35% | 6 | 3,733 | 1.82% |
| 6 | JPMorgan Chase | 5,545 | 2.16% | 5 | 3,950 | 1.93% |
| 7 | Citizens Bank | 4,959 | 1.93% | 4 | 4,095 | 2.00% |
| 8 | United Wholesale Mortgage | 4,084 | 1.59% | 51 | 716 | 0.35% |
| 9 | TD Bank | 3,122 | 1.22% | 12 | 2,748 | 1.34% |
| 10 | The Huntington National Bank | 3,042 | 1.18% | 7 | 3,431 | 1.67% |
Top Lenders by 2025 Completed Adjustable-Rate Mortgages
Here’s a quick look at the top 10 mortgage lenders ranked by the number of adjustable-rate purchase loans they completed in 2025.
1. Bank of America
Fun fact: The Bank of America that we know today with a headquarters in Charlotte, N.C., started out in 1904 as Bank of Italy in San Francisco with the mission of serving the immigrants other banks discriminated against. BoA topped all lenders in adjustable-rate mortgages for the second straight year in 2025, taking up nearly 3% of the market.
2. State Employees’ Credit Union
State Employees’ Credit Union, or SECU, is the second-largest credit union in the country, as well as a not-for-profit member-owned cooperative, according to its website. BoA’s neighbor in Raleigh, SECU climbed one spot in 2025 and was the only other lender above 7,000 ARM originations.
3. Lennar Mortgage
Another lender rising in the ranks from the year prior, Miami-based Lennar Mortgage was founded in 1973 and serves 32 states with 57+ branches across the U.S. It is also the official affiliated lender of Lennar Homes, the country’s second-largest home builder, whose West Coast growth helped the company rank as the year's largest retail lender in California.
4. U.S. Bank
Headquartered in Minneapolis, U.S. Bank holds the titles of largest bank in the Midwest and fifth largest by assets in the country as of the end of 2025, according to the Federal Reserve. The bank fell from #2 in ARM originations in 2024.
5. Wells Fargo
Established in San Francisco in 1852, Wells Fargo placed fifth in ARM originations. The West Coast banking giant was the last on the list to generate over 6,000 originations.
6. JPMorgan Chase
With its roots tracing back to New York in 1799, few banks carry more name recognition than JPMorgan Chase. It’s also the final lender to garner an ARM market share above 2%. Looking for a larger mortgage? JPMorgan Chase ranked #1 for the year in total number of loans over $1 million.
7. Citizens Bank
Founded in 1828, the Rhode Island-based Citizens Bank lends in 47 states and Washington, D.C. Citizens tied for the biggest tumble in ARMs dealing, falling three spots in 2025.
8. United Wholesale Mortgage
As its name suggests, UWM is a wholesale lender. That means smaller mortgage brokers take borrower applications and send the full loan file to UWM for underwriting. In other words, wholesale lenders are the “engine” behind this mortgage process. UWM took the largest leap in the rankings, jumping from #51 in 2024 to #8 in 2025. United Wholesale Mortgage also ranked second for cash-out refinances for the year.
9. TD Bank
TD Bank primarily exists in 15 states on the East Coast and has its headquarters outside of Philadelphia in Mount Laurel, N.J. TD rose in the latest rankings after barely missing the top-10 cut in 2024.
10. The Huntington National Bank
Established in 1866, Huntington National has its base in Columbus, Ohio, and over 1,000 branches mostly scattered across the Midwest. Along with Citizens, Huntington was the other top-10 ARM lender that fell three spots year-over-year.
ARM Trends
As mortgage rates and home prices remained (and still remain) elevated, ARM volume climbed about 25.2% annually in 2025, according to the most recent Home Mortgage Disclosure Act (HMDA) data. Meanwhile, its share of overall purchase originations went from 6.6% to 8.2%.

The table below shows the last five years of available data, comparing ARMs to the more popular fixed-rate mortgages (FRM).
| Market Share | Purchase Originations* | Originations YoY% | Active Lenders | Median Loan Amount | Median Property Value | |
|---|---|---|---|---|---|---|
| 2021 ARMs | 3.88% | 182,243 | - | 1,655 | $335,000 | $625,000 |
| 2021 FRMs | 96.12% | 4,513,047 | - | 4,141 | $275,000 | $325,000 |
| 2022 ARMs | 9.23% | 351,639 | 92.95% | 2,068 | $395,000 | $585,000 |
| 2022 FRMs | 90.77% | 3,457,887 | -23.38% | 4,214 | $295,000 | $355,000 |
| 2023 ARMs | 8.30% | 253,887 | -27.80% | 1,923 | $395,000 | $575,000 |
| 2023 FRMs | 91.70% | 2,804,149 | -18.91% | 4,704 | $295,000 | $355,000 |
| 2024 ARMs | 6.59% | 205,125 | -19.21% | 1,678 | $445,000 | $655,000 |
| 2024 FRMs | 93.41% | 2,905,681 | 3.62% | 4,543 | $305,000 | $365,000 |
| 2025 ARMs | 8.16% | 256,763 | 25.17% | 1,698 | $465,000 | $655,000 |
| 2025 FRMs | 91.84% | 2,890,358 | -0.53% | 4,406 | $305,000 | $365,000 |
*Owner-occupied, 1-4 unit purchase mortgages
Find the Right ARM Lender for You
With a lack of affordability hampering so many potential homebuyers, adjustable-rate mortgages grew in popularity last year.
Finding your lender could prove slightly more difficult since fewer mortgage companies offer adjustable-rate financing. ARMs also come with multiple options, and each lender provides different terms — making it imperative you shop around to (hopefully) lower your monthly payment.
Ready to take the next step? Contact a local ARM lender to get started.
All figures based on 2025 Home Mortgage Disclosure Act (HMDA) data provided by the Consumer Financial Protection Bureau (CFPB) and accessed July 10, 2026, through PolygonResearch.com HMDAVision.