



The mere mention of an adjustable-rate mortgage (ARM) conjures up images of foreclosures, no-doc loans, and the excesses of the 2008 housing crash.
But it turns out it’s a new day for ARMs.
Things have changed a lot in the nearly two decades since the downturn, with responsible underwriting rules, rate caps, and consumer protections.
When fixed rates run high, some borrowers opt for an ARM, placing a bet that average rates will be lower when their ARM starts adjusting. Depending on your situation and personal preferences, 2026 could be a good time to get an ARM.
ARMs can be a path to improved affordability through a lower interest rate that, in turn, makes your monthly payment less expensive. So it’s no surprise that many of the country’s priciest metros account for the greatest numbers of ARM originations.
Top 25 Metropolitan Areas with the Most Adjustable-Rate Mortgages Completed in 2025
In 2025, a total of 1,698 lenders originated 256,763 owner-occupied adjustable-rate purchase mortgages for 1-4 unit properties.
This collection of mortgages had a median loan amount of $465,000; a median property value of $655,000; and a median borrower income of $189,000.
To find the top metropolitan statistical areas by ARMs, Mortgage Research Network analyzed the latest HMDA data using Polygon Research’s HMDAVision.
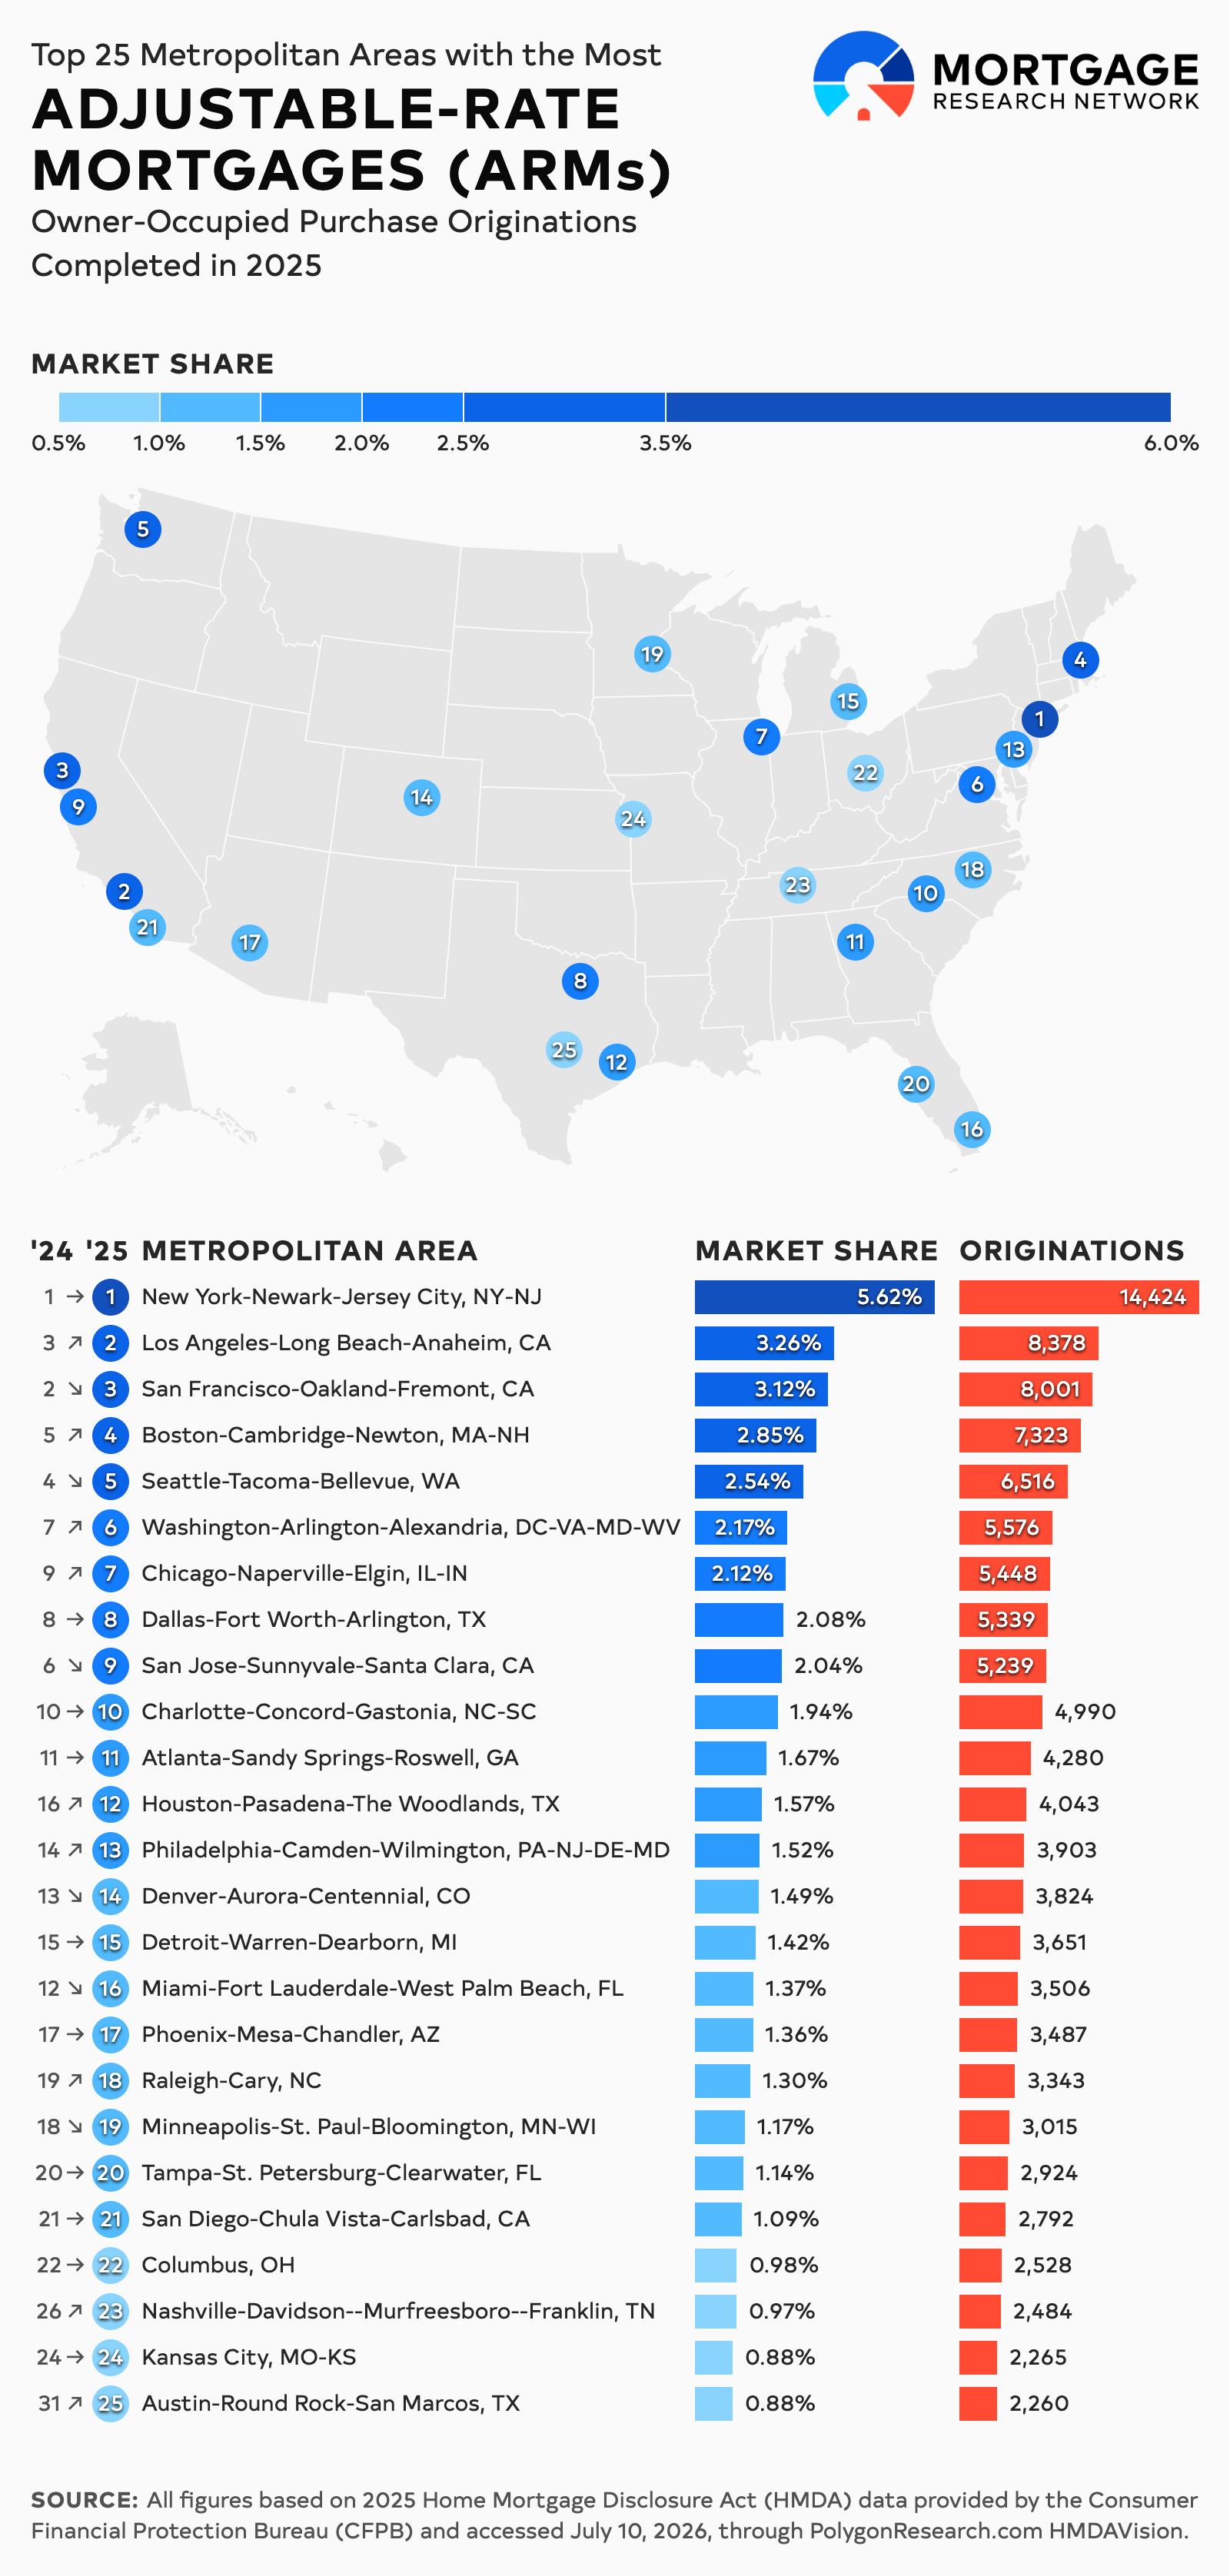
New York retained the No. 1 spot for ARMs (and has every year since at least 2021), with 14,424 originations and a 5.62% share of the nationwide ARM market. Los Angeles, its continental antipode, followed with 8,378 and 3.26%, moving up one spot from 2024.
San Francisco (8,001; 3.12%), Boston (7,323; 2.85%), and Seattle (6,516; 2.54%) rounded out the top five. Meanwhile, 26,536, or 10.33% of 2025’s ARM originations, fell outside defined MSAs
| Rank | Metropolitan Statistical Area | Originations | Market Share | 2024 Rank |
|---|---|---|---|---|
| 1 | New York-Newark-Jersey City, NY-NJ | 14,424 | 5.62% | 1 |
| 2 | Los Angeles-Long Beach-Anaheim, CA | 8,378 | 3.26% | 3 |
| 3 | San Francisco-Oakland-Fremont, CA | 8,001 | 3.12% | 2 |
| 4 | Boston-Cambridge-Newton, MA-NH | 7,323 | 2.85% | 5 |
| 5 | Seattle-Tacoma-Bellevue, WA | 6,516 | 2.54% | 4 |
| 6 | Washington-Arlington-Alexandria, DC-VA-MD-WV | 5,576 | 2.17% | 7 |
| 7 | Chicago-Naperville-Elgin, IL-IN | 5,448 | 2.12% | 9 |
| 8 | Dallas-Fort Worth-Arlington, TX | 5,339 | 2.08% | 8 |
| 9 | San Jose-Sunnyvale-Santa Clara, CA | 5,239 | 2.04% | 6 |
| 10 | Charlotte-Concord-Gastonia, NC-SC | 4,990 | 1.94% | 10 |
| 11 | Atlanta-Sandy Springs-Roswell, GA | 4,280 | 1.67% | 11 |
| 12 | Houston-Pasadena-The Woodlands, TX | 4,043 | 1.57% | 16 |
| 13 | Philadelphia-Camden-Wilmington, PA-NJ-DE-MD | 3,903 | 1.52% | 14 |
| 14 | Denver-Aurora-Centennial, CO | 3,824 | 1.49% | 13 |
| 15 | Detroit-Warren-Dearborn, MI | 3,651 | 1.42% | 15 |
| 16 | Miami-Fort Lauderdale-West Palm Beach, FL | 3,506 | 1.37% | 12 |
| 17 | Phoenix-Mesa-Chandler, AZ | 3,487 | 1.36% | 17 |
| 18 | Raleigh-Cary, NC | 3,343 | 1.30% | 19 |
| 19 | Minneapolis-St. Paul-Bloomington, MN-WI | 3,015 | 1.17% | 18 |
| 20 | Tampa-St. Petersburg-Clearwater, FL | 2,924 | 1.14% | 20 |
| 21 | San Diego-Chula Vista-Carlsbad, CA | 2,792 | 1.09% | 21 |
| 22 | Columbus, OH | 2,528 | 0.98% | 22 |
| 23 | Nashville-Davidson--Murfreesboro--Franklin, TN | 2,484 | 0.97% | 26 |
| 24 | Kansas City, MO-KS | 2,265 | 0.88% | 24 |
| 25 | Austin-Round Rock-San Marcos, TX | 2,260 | 0.88% | 31 |
ARM Trends
Adjustable-rate mortgages offer the allure of lower interest rates compared to fixed-rate mortgages. A lower rate allows homebuyers and refinancing homeowners to expand their budget or simply make their monthly payment more affordable.
ARMs come with an initial fixed-rate period and recurring adjustments. By the time that initial period ends, ARM borrowers either bet on lower average rates or moving to another house. Because of this speculative measure, ARMs tend to ebb and flow with the mortgage rate cycle, gaining popularity when fixed rates run higher.
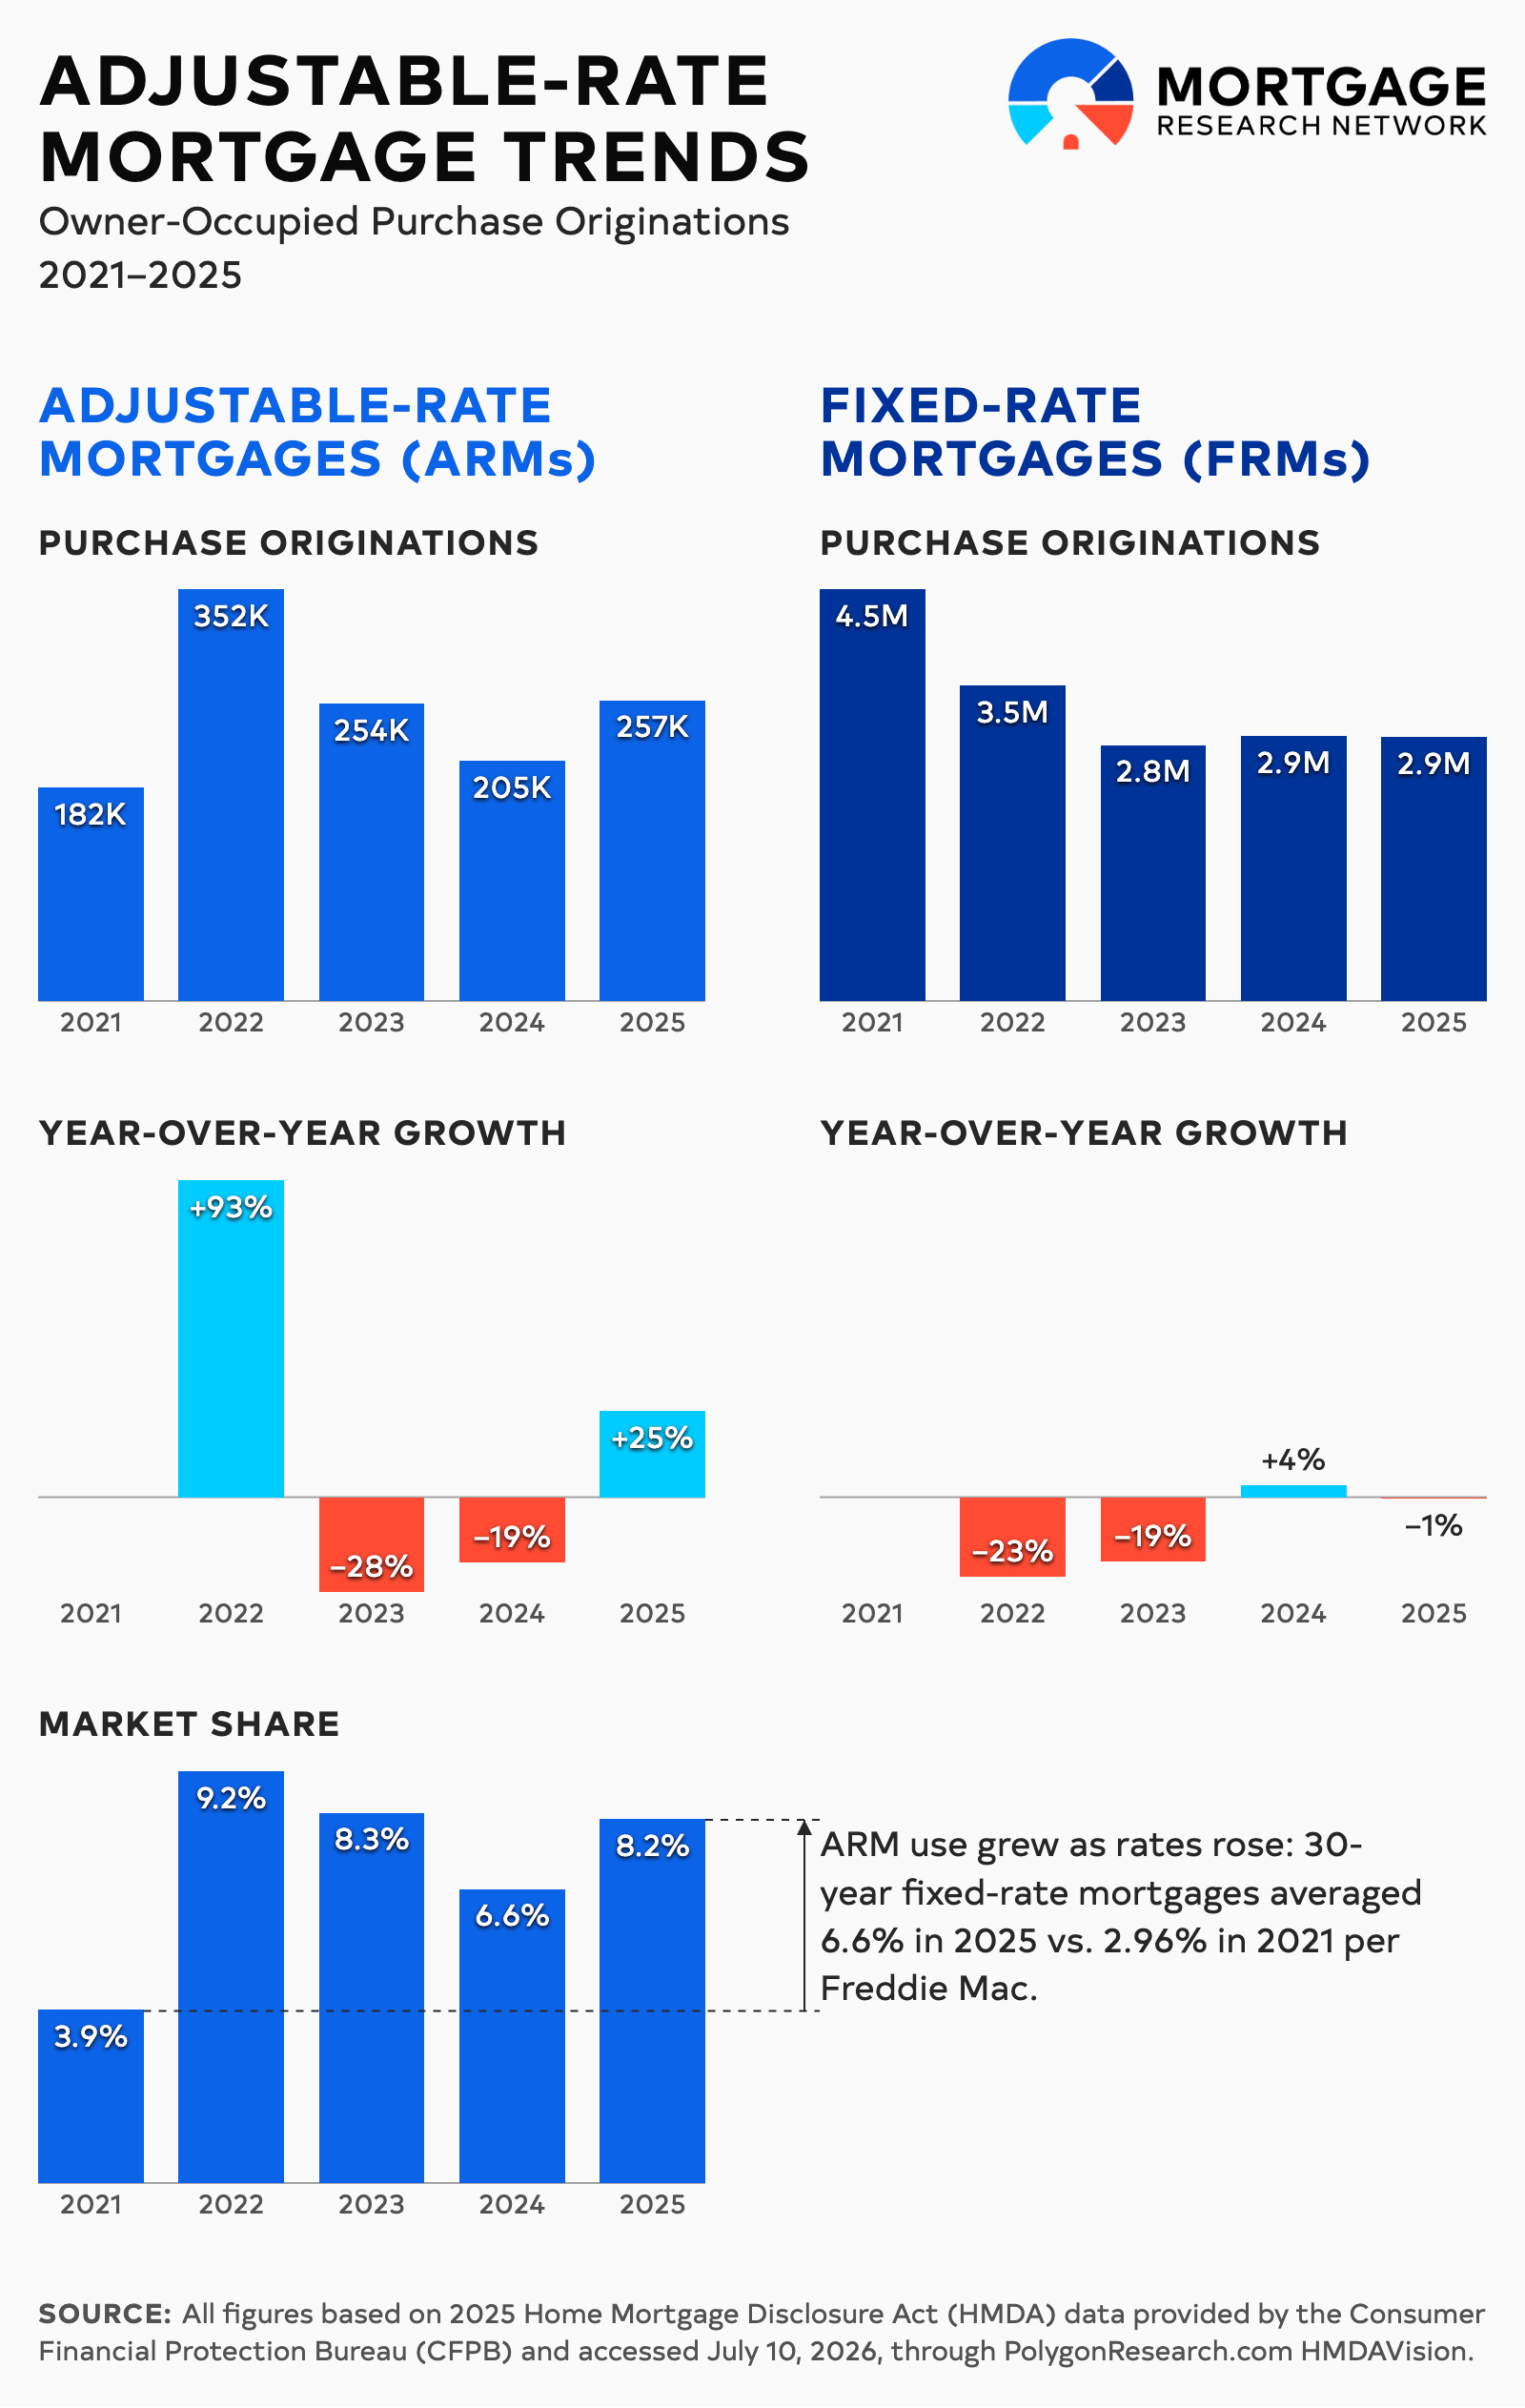
2025’s nearly 257k ARM originations accounted for 8.2% of the overall purchase marketplace. Those totals grew from 182k and 3.9% in 2021. The 30-year fixed rate averaged 6.6% in 2025 compared to 2.96% in 2021, according to Freddie Mac. Notably, ARMs saw a groundswell of 93% annual growth in 2022 once inflation started ballooning and interest rates jumped to an average of 5.34%.
The table below shows a yearly analysis of 1-4 unit owner-occupied purchase originations from 2021 to 2025:
| Year | ARMs | FRMs | Total | ARM Market Share | ARMs Year-Over-Year Growth | FRMs Year-Over-Year Growth |
|---|---|---|---|---|---|---|
| 2021 | 182,243 | 4,513,047 | 4,695,290 | 3.88% | ||
| 2022 | 351,639 | 3,457,887 | 3,809,526 | 9.23% | 92.95% | -23.38% |
| 2023 | 253,887 | 2,804,149 | 3,058,036 | 8.30% | -27.80% | -18.91% |
| 2024 | 205,125 | 2,905,681 | 3,110,806 | 6.59% | -19.21% | 3.62% |
| 2025 | 256,763 | 2,890,358 | 3,147,121 | 8.16% | 25.17% | -0.53% |
Choosing the Right Lender for You
Not every mortgage lender offers adjustable-rate financing. In fact, about 2.5x more lenders originated fixed-rate purchase loans in 2025.
Although there’s a smaller pool to choose from, you should still comparison shop in order to better negotiate your terms. Getting multiple quotes is a proven way to save money over the life of your mortgage.
When you’re ready to begin, reach out to a lender in your area to get started.
All figures based on 2025 Home Mortgage Disclosure Act (HMDA) data provided by the Consumer Financial Protection Bureau (CFPB) and accessed July 10, 2026, through PolygonResearch.com HMDAVision.