



When you’re a financial product born out of the Great Recession, it can feel like you come with a scarlet letter. Meanwhile, the name you were given certainly doesn’t help matters. But non-qualified mortgages (non-QM) could just be a marketing change away from becoming more mainstream.
After subprime lending led to the housing crash and left many people in dire straits, the Consumer Financial Protection Bureau (CFPB) established a new set of rules to avoid a sequel and defined “qualified mortgages.” The Bureau’s new parameters to lower mortgage risk centered around the borrower’s ability to repay. If you couldn’t tick off all the boxes on the checklist, you could apply for a non-QM loan.
But worry not, there’s no shame in non-QM financing. In fact, they accounted for about a tenth of all owner-occupied and over a fifth of investment property purchase originations in 2025, according to the latest Home Mortgage Disclosure Act (HMDA) data. Further, non-QM lending’s annual growth rate overshadowed the overall market in both cases.
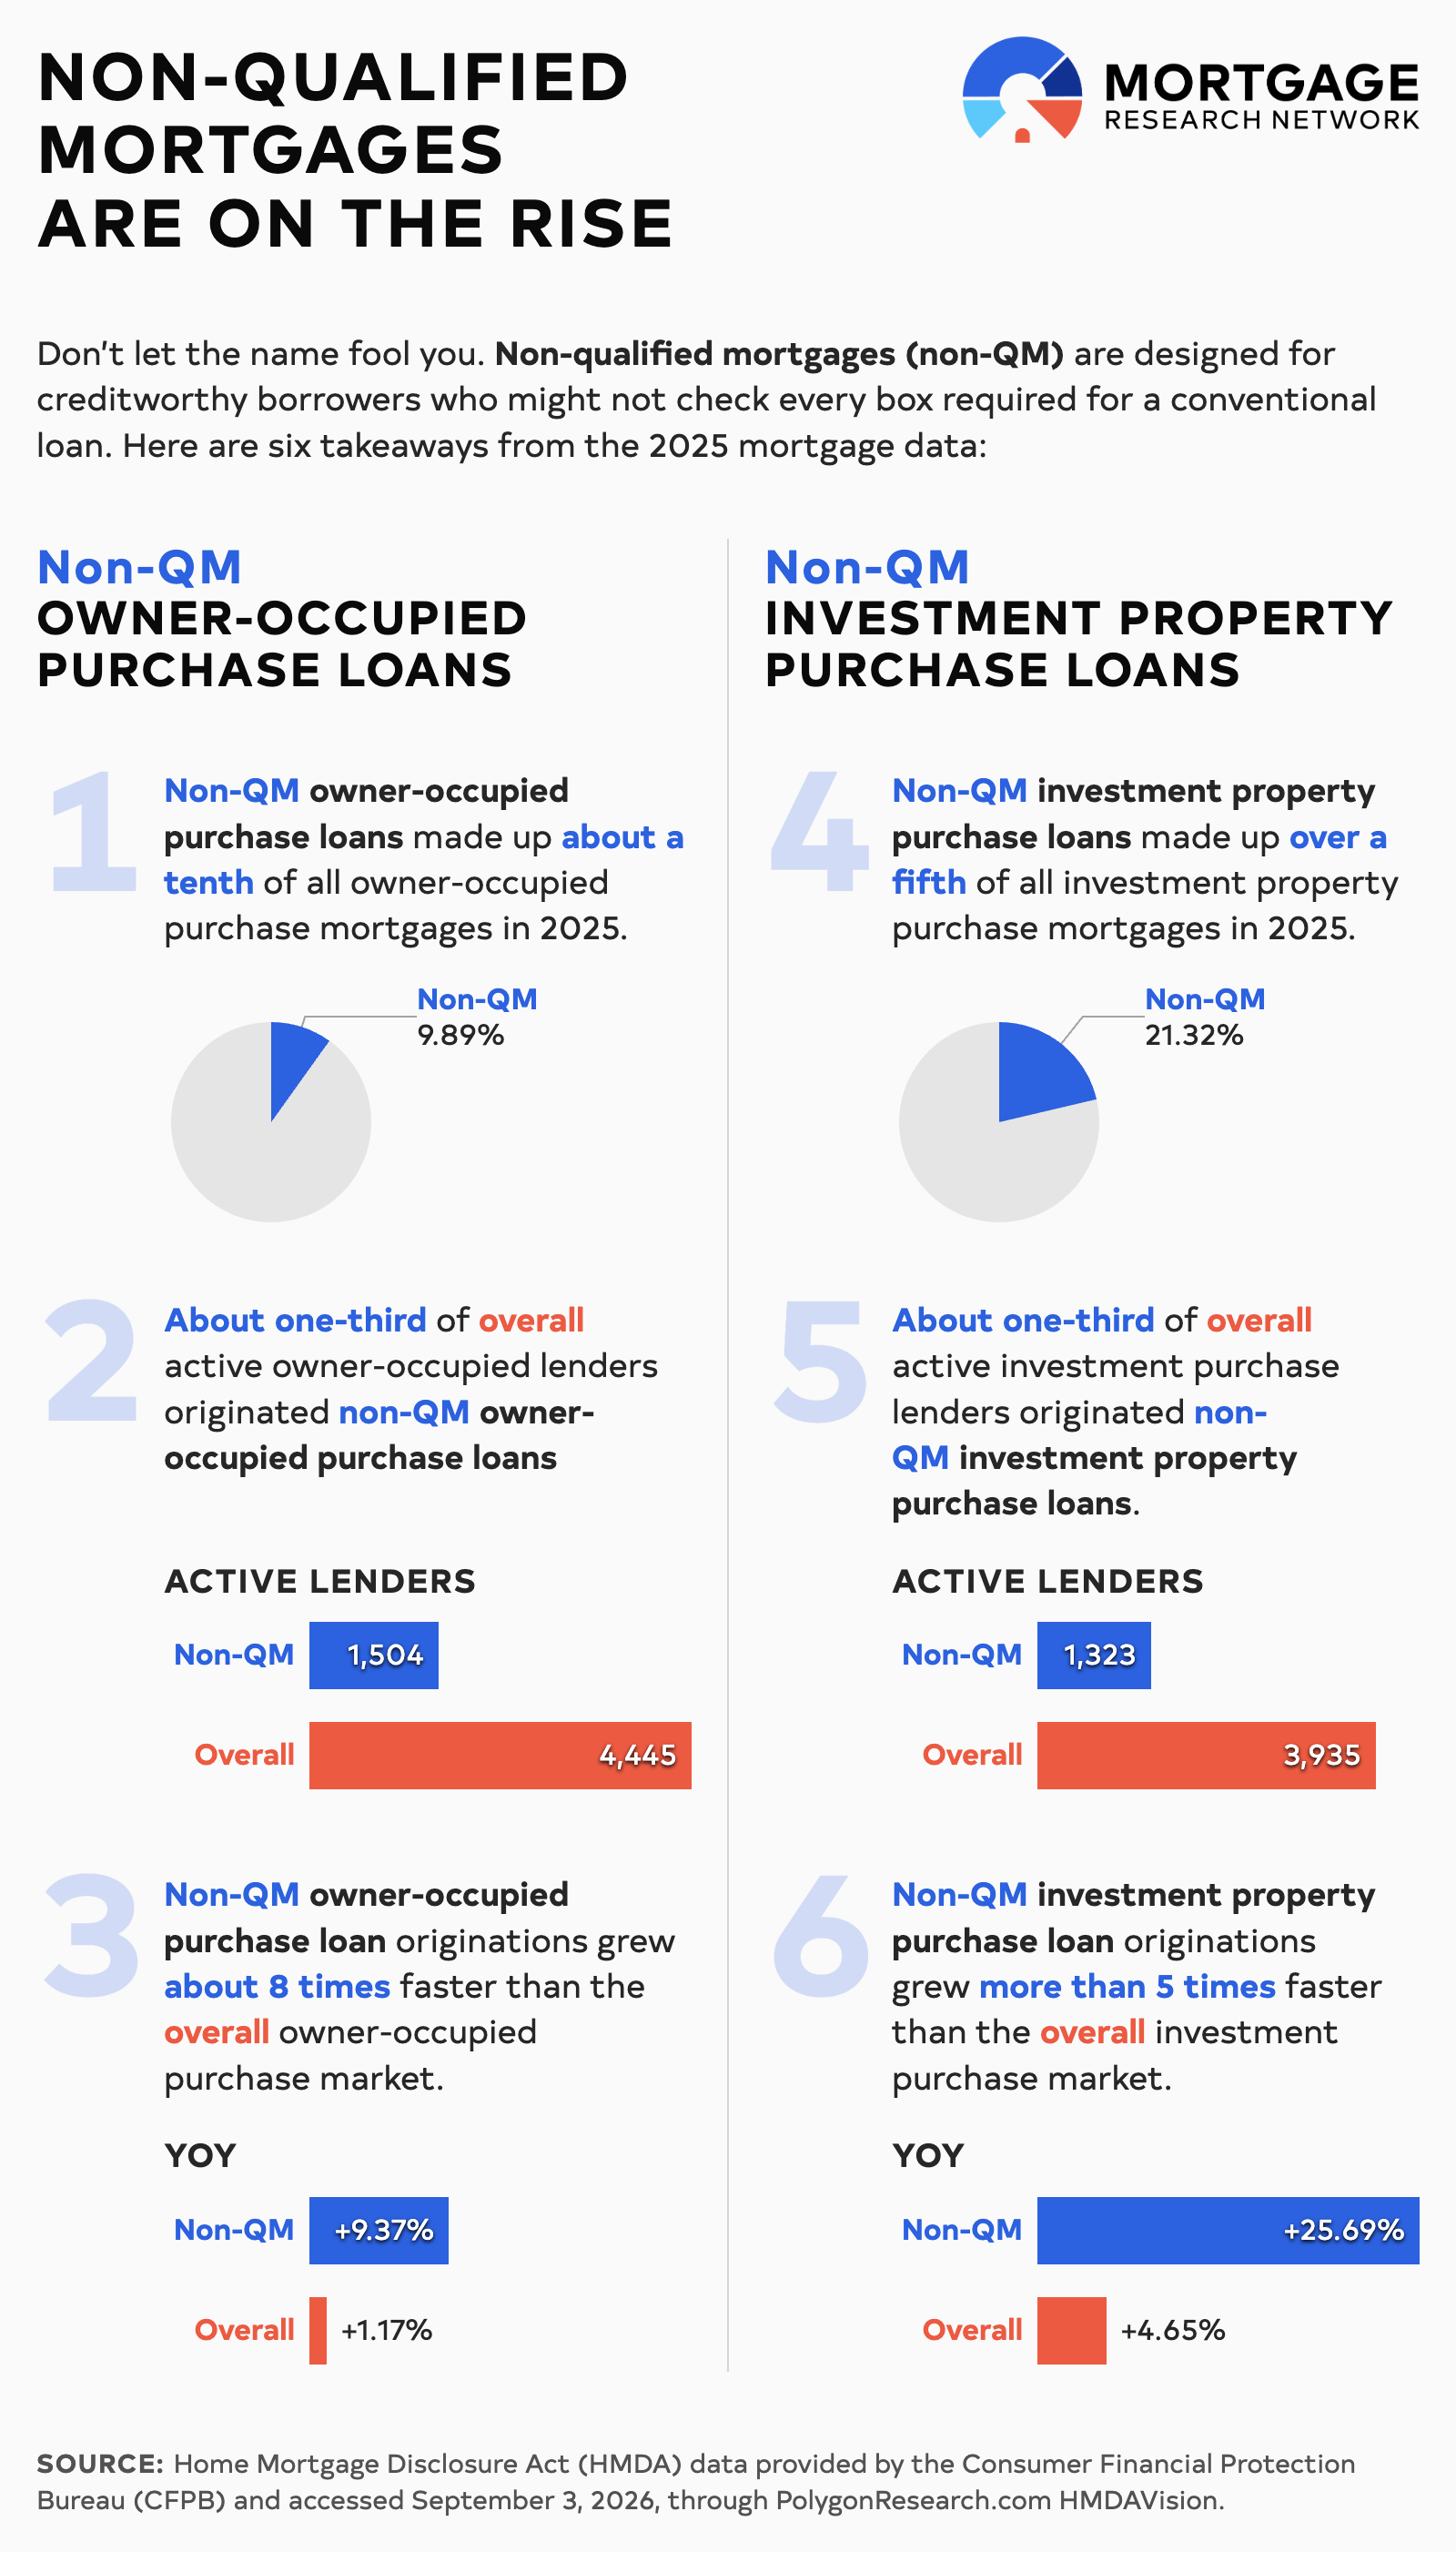
The table below shows the full snapshot of non-QM borrowing in 2025 compared to its umbrella purchase segments.
| 2025 | Non-QM Owner-Occupied | All Owner-Occupied | Non-QM Investment | All Investment |
|---|---|---|---|---|
| Originations | 311,288 | 3,147,121 | 70,779 | 331,973 |
| Active lenders | 1,504 | 4,445 | 1,323 | 3,935 |
| Median loan amount | $255,000 | $315,000 | $245,000 | $235,000 |
| Median property value | $335,000 | $385,000 | $345,000 | $345,000 |
| Median applicant income | $100,000 | $112,000 | $128,000 | $167,000 |
| YoY | 9.37% | 1.17% | 25.69% | 4.65% |
| Market Share | 9.89% | 21.32% |
Top 10 Lenders for Non-QM Purchase Loans Completed in 2025
For prospective homebuyers who don’t meet all the conventional mortgage guidelines but have otherwise creditworthy profiles, non-QM loans still offer a safe lending option.
Typically, not having a W-2 income is the unchecked box that turns QM borrowing into non-QM borrowing. As self-employment and gig work — which usually classify as 1099 income — grow, so could this sector of home financing.
“We’re not talking about subprime borrowers,” Mike Pearson, senior vice president at AD Mortgage, said on a recent episode of the Mortgage Research Network Podcast. “The average credit score for most non-QM is greater than 760. So the quality of the borrowers, the amount of down payment that is required and all those things, lead to a different credit profile than what many people might think for non-QM.”
To identify the lenders leading this corner of the market, Mortgage Research Network analyzed the most recent HMDA data using Polygon Research's HMDAVision and found that 1,504 lenders originated 311,288 owner-occupied non-QM purchase mortgages for 1-4 unit properties in 2025. That volume grew 9.37% year-over-year. Meanwhile, the overall purchase market for primary residences had 4,445 lenders generate 3.15 million originations, up 1.17% annually.
| Year | 2025 | 2024 | 2023 | 2022 | 2021 | 2020 |
|---|---|---|---|---|---|---|
| Originations | 311,288 | 284,615 | 288,881 | 330,932 | 407,716 | 726,192 |
| Active lenders | 1,504 | 1,562 | 1,732 | 1,955 | 1,884 | 2,462 |
| Median interest rate | 6.65% | 6.88% | 6.75% | 5.25% | 3.25% | 3.25% |
| Median loan amount | $255,000 | $245,000 | $255,000 | $265,000 | $245,000 | $235,000 |
| Median property value | $335,000 | $325,000 | $325,000 | $335,000 | $305,000 | $265,000 |
| Median applicant income | $100,000 | $97,000 | $95,000 | $90,000 | $79,000 | $69,000 |
| YoY | 9.37% | -1.48% | -12.71% | -18.83% | -43.86% | -13.27% |
| Market Share | 9.89% | 9.15% | 9.45% | 8.69% | 8.68% | 16.54% |
The metropolitan statistical areas (MSAs) with the largest non-QM loan volume include some of the most populous, high-demand, and expensive in the country.
In 2025, non-QM loans had a median loan amount of $255,000 compared to $315,000 for overall purchases, a median property value of $355,000 (versus $385,000), and a median borrower income of $100,000 (versus $112,000).
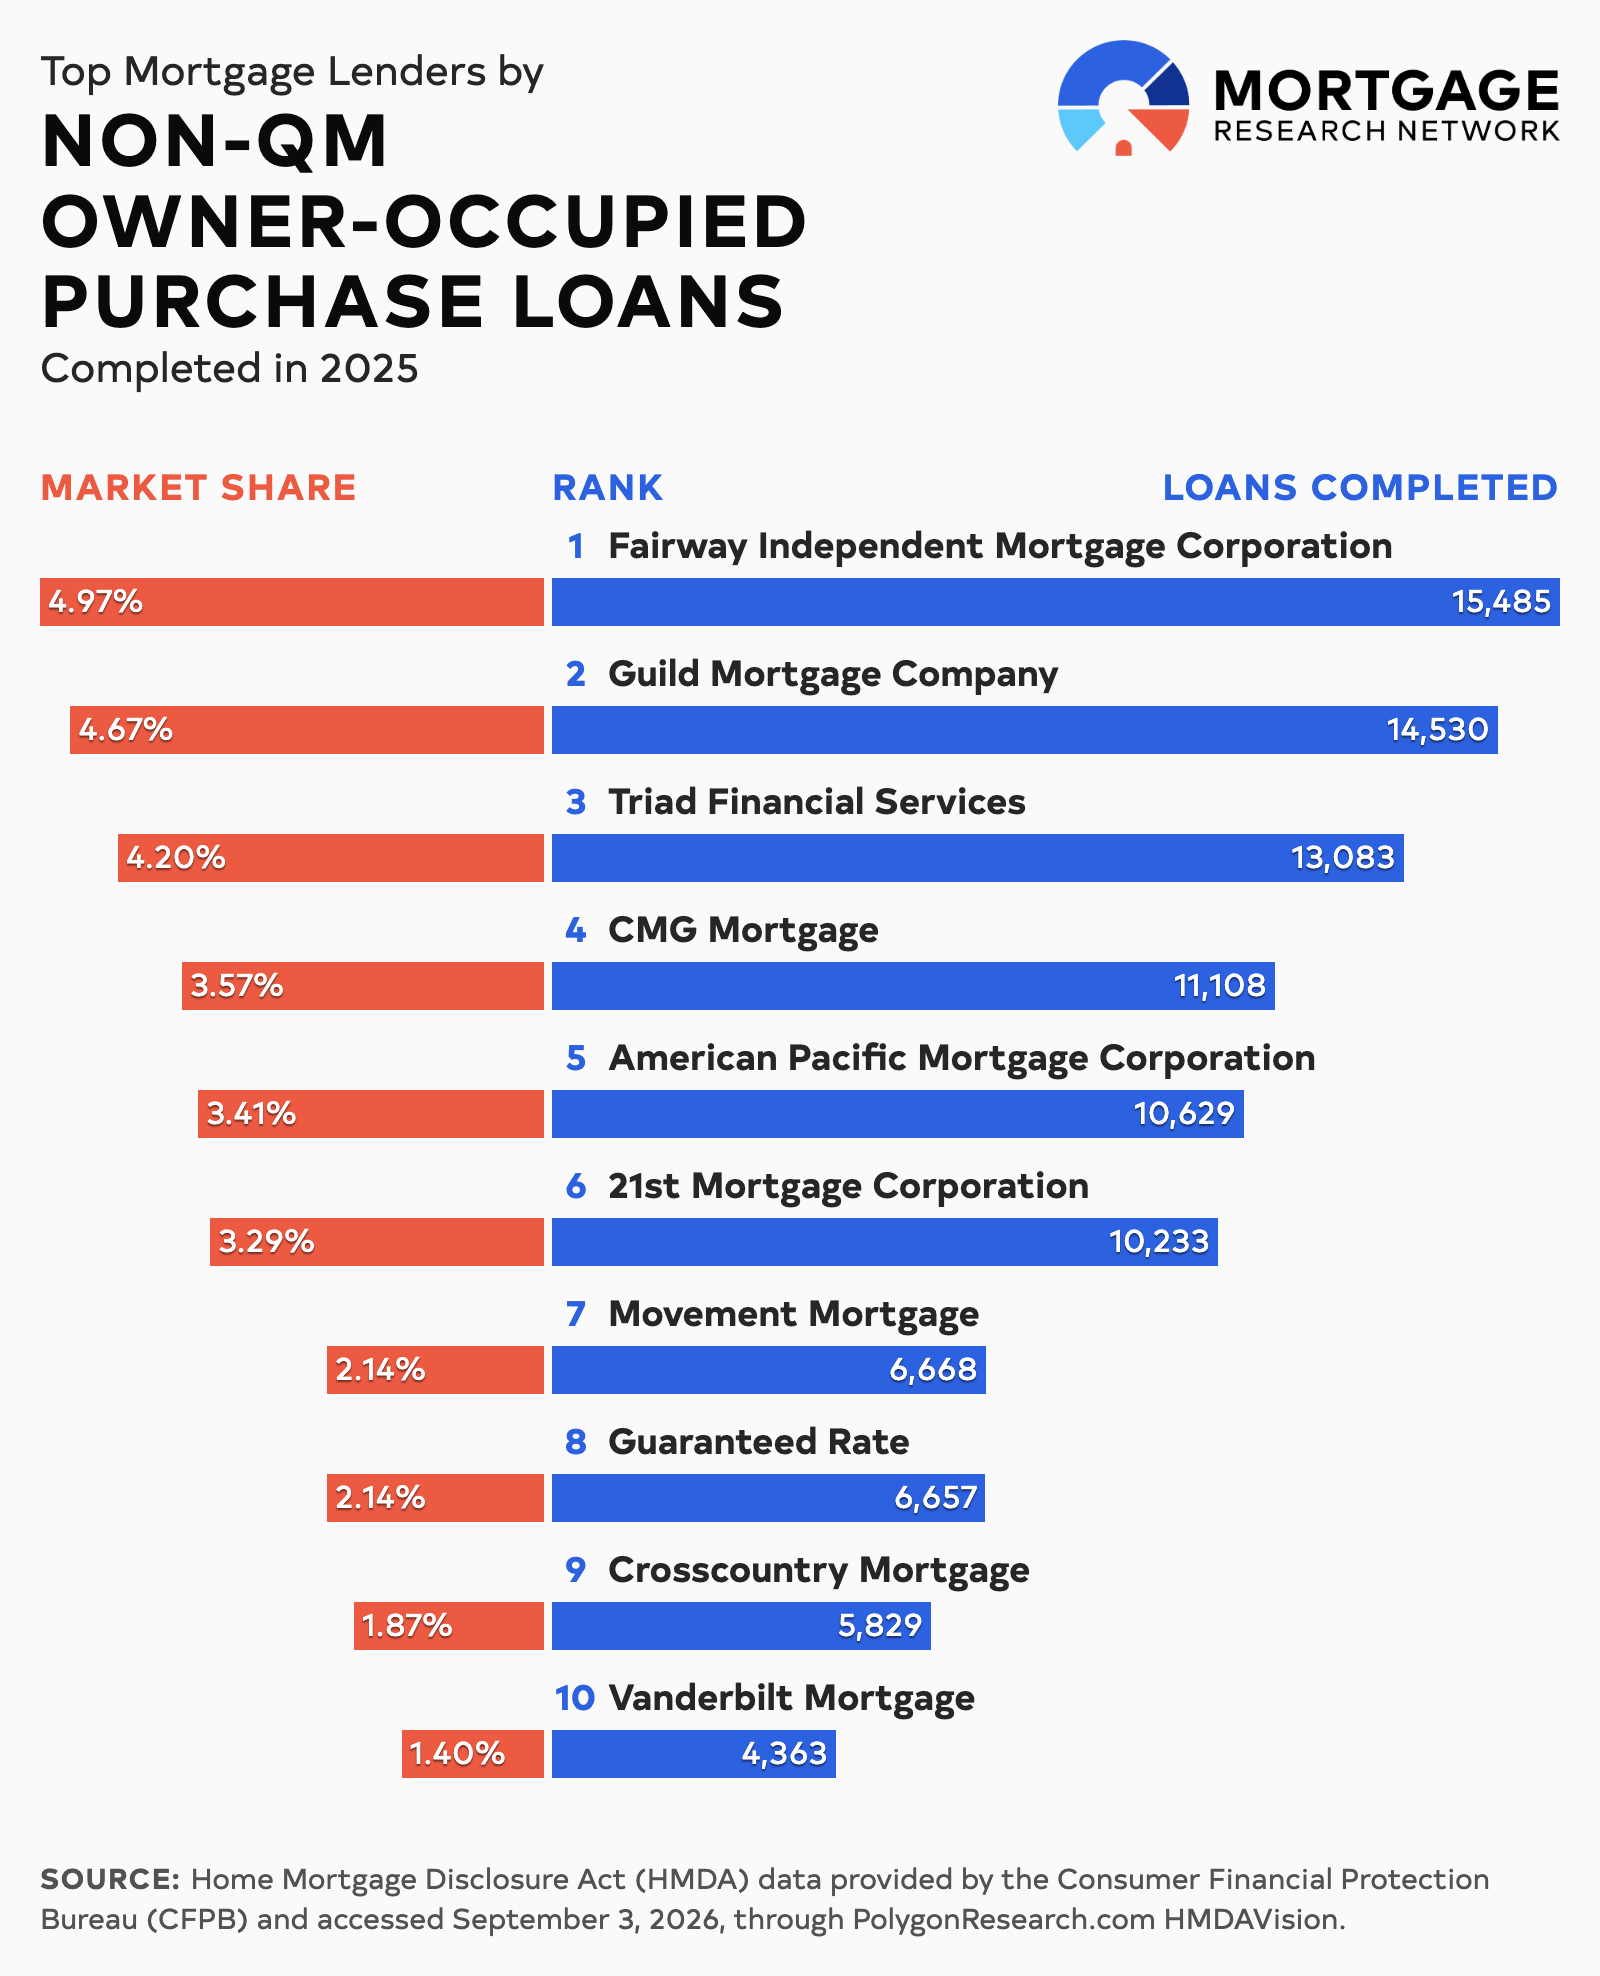
While no individual lender surpassed a 5% share of the non-QM marketplace, the year’s top 10 lenders accounted for nearly 32% of the volume. The table below ranks them by completed originations:
| 2025 Rank | Lender Name | Originations | Lender Market Share |
|---|---|---|---|
| 1 | Fairway Independent Mortgage Corporation | 15,485 | 4.97% |
| 2 | Guild Mortgage Company | 14,530 | 4.67% |
| 3 | Triad Financial Services | 13,083 | 4.20% |
| 4 | CMG Mortgage | 11,108 | 3.57% |
| 5 | American Pacific Mortgage Corporation | 10,629 | 3.41% |
| 6 | 21st Mortgage Corporation | 10,233 | 3.29% |
| 7 | Movement Mortgage | 6,668 | 2.14% |
| 8 | Guaranteed Rate | 6,657 | 2.14% |
| 9 | Crosscountry Mortgage | 5,829 | 1.87% |
| 10 | Vanderbilt Mortgage | 4,363 | 1.40% |
Top 10 Lenders for Non-QM Investment Loans Completed in 2025
Non-QM loans are also popular among real estate investors, accounting for about a fifth of overall investment loans since at least 2020.
One major reason is the debt service coverage ratio (DSCR) loan. DSCR loans draw investors like moths to a flame because a borrower can qualify based on the property’s rental income, not their individual earnings.
That typically means that self-employed investors don’t have to submit hundreds of pages of tax returns, P&L statements, and CPA letters, nor do they have to stay within standard debt-to-income ratio limits that can become increasingly difficult to meet when you're carrying financing on multiple investment properties.
Mortgage Research Network analyzed the latest HMDA data and found 1,323 lenders originated 70,779 non-QM investment purchase mortgages for 1-4 unit properties in 2025. This group of originations jumped 25.69% year over year. Meanwhile, the overall investment property market had 3,935 lenders and 331,973 originations, up 4.65% year over year.
| Year | 2025 | 2024 | 2023 | 2022 | 2021 | 2020 |
|---|---|---|---|---|---|---|
| Originations | 70,779 | 56,311 | 52,050 | 76,986 | 75,735 | 45,565 |
| YoY | 25.69% | 8.19% | -32.39% | 1.65% | 66.21% | -23.83% |
| Active lenders | 1,323 | 1,330 | 1,469 | 1,581 | 1,517 | 1,855 |
| Median loan amount | $245,000 | $235,000 | $215,000 | $225,000 | $215,000 | $155,000 |
| Median property value | $345,000 | $335,000 | $305,000 | $315,000 | $295,000 | $225,000 |
| Median applicant income | $128,000 | $138,000 | $136,000 | $128,000 | $134,000 | $120,000 |
| Non-QM Investment Market Share | 21.32% | 17.75% | 18.16% | 19.86% | 18.21% | 16.32% |
In 2025, non-QM investment loans had a median loan amount of $245,000 versus $235,000 for overall investment purchases, a median property value of $345,000 (versus $345,000), and a median borrower income of $128,000 (versus $167,000).
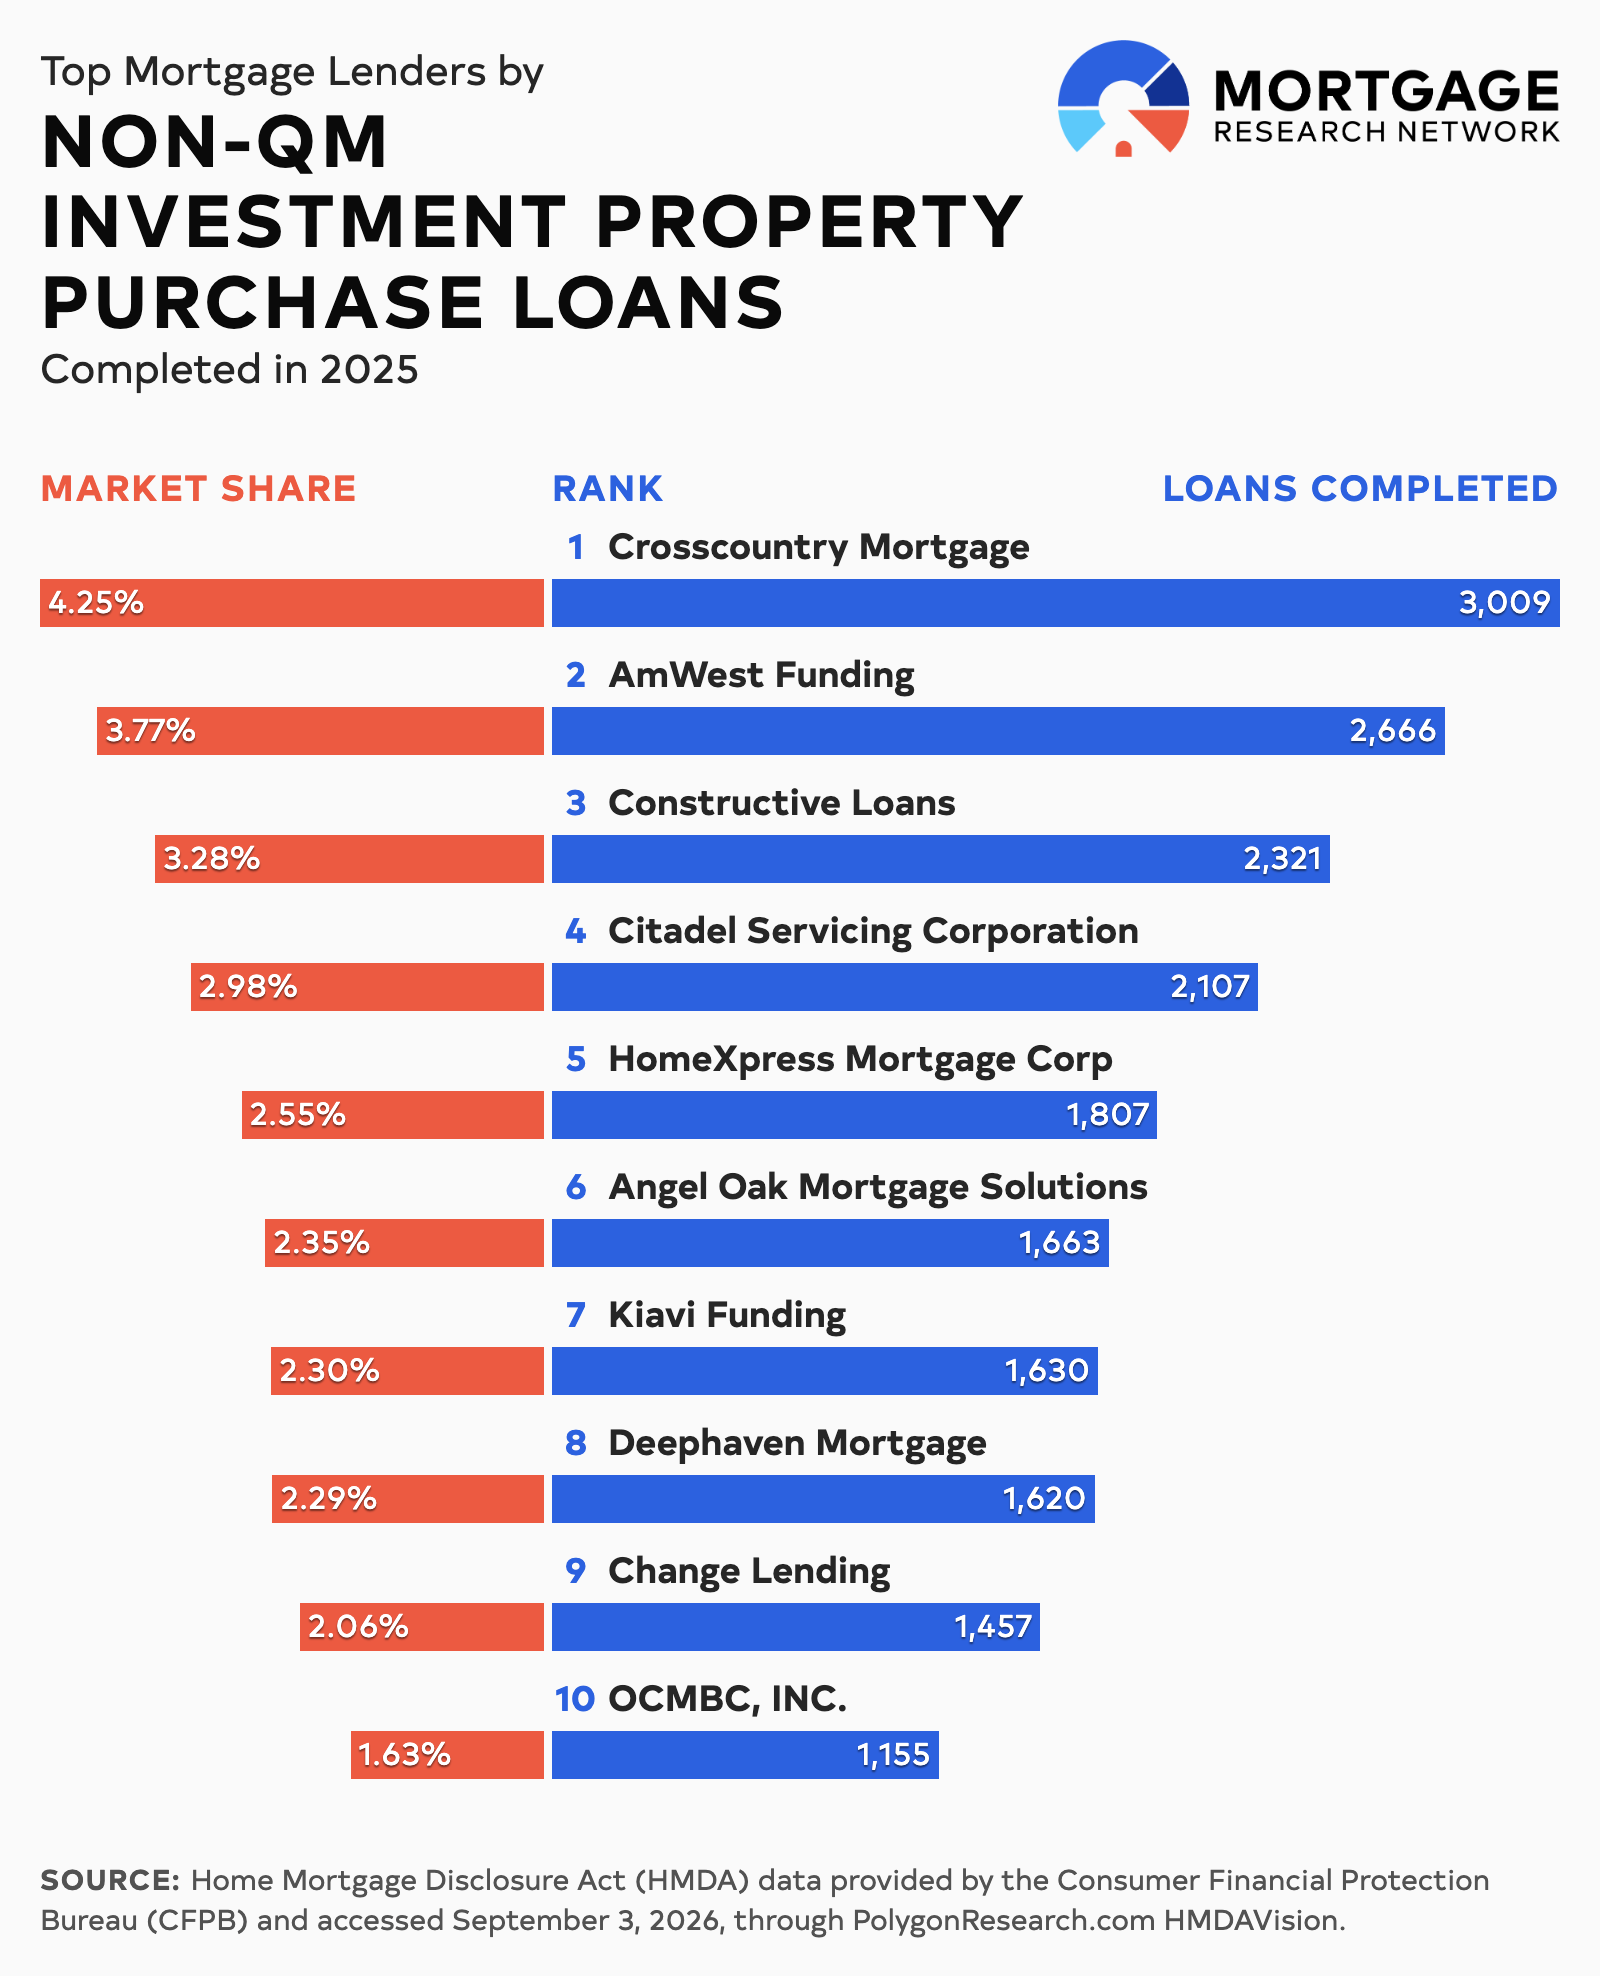
While no single lender held a 5% stake in the non-QM investment marketplace, the year’s top 10 lenders accounted for over 27% of the volume. The table below ranks them by originations completed in 2025:
| 2025 Rank | Lender Name | Originations | Lender Market Share |
|---|---|---|---|
| 1 | Crosscountry Mortgage | 3,009 | 4.25% |
| 2 | AmWest Funding | 2,666 | 3.77% |
| 3 | Constructive Loans | 2,321 | 3.28% |
| 4 | Citadel Servicing Corporation | 2,107 | 2.98% |
| 5 | HomeXpress Mortgage Corp | 1,807 | 2.55% |
| 6 | Angel Oak Mortgage Solutions | 1,663 | 2.35% |
| 7 | Kiavi Funding | 1,630 | 2.30% |
| 8 | Deephaven Mortgage | 1,620 | 2.29% |
| 9 | Change Lending | 1,457 | 2.06% |
| 10 | OCMBC, INC. | 1,155 | 1.63% |
Why Do Homebuyers Use Non-QM?
Non-QM loans offer a sound lending product to a wider swath of borrowers than conventional mortgages.
Typical non-QM borrowers are either homebuyers with non-traditional income (usually because they’re self-employed) or real estate investors. Non-QM financing provides flexibility for both borrower types, accepting non-W-2 income, bank statements, liquid assets, and rental cash flow in its underwriting.
Non-QM lending products include asset-based loans, bank statement loans, debt service coverage ratio (DSCR) loans, foreign national loans, and interest-only mortgages.
Find the Right Non-QM Lender for You
Whether you're buying your own home or an investment property, a non-QM loan could be your best bet — especially if you’re having trouble clearing all the conventional mortgage hurdles.
But just like with any mortgage, you should take the steps to prepare, see if you qualify for financial assistance, and get multiple quotes so you can better negotiate your terms.
If you sound like you’d be a good fit for a non-QM loan, talk with a local lender to get started.
All figures based on Home Mortgage Disclosure Act (HMDA) data provided by the Consumer Financial Protection Bureau (CFPB) and accessed September 3, 2026, through PolygonResearch.com HMDAVision.