


No, we’re not pulling your arm. The adjustable-rate mortgage (ARM) is back in style for high-end homebuyers.
Going back to at least 2021, borrowers who took out an ARM boasted better financial profiles and loan-to-value (LTV) ratios than their fixed-rate mortgage (FRM) counterparts.
Although ARMs justifiably fell out of favor after helping usher in 2008’s housing collapse, they’re being used to hedge against today’s high interest rate environment and increase buyer affordability.
In 2025, ARM purchase originations grew annually by 25.2% while FRM originations fell 0.5%, according to the most recent Home Mortgage Disclosure Act (HMDA) data analyzed through Polygon Research’s HMDAVision. Though ARMs still account for less than a tenth of owner-occupied, 1-4 unit purchase originations, the market share rose to 8.2% from 6.6% in 2024.
| Purchase Originations | Originations YoY% | Purchase Market Share | Active Lenders | |
|---|---|---|---|---|
| 2021 ARMs | 182,243 | - | 3.88% | 1,655 |
| 2021 FRMs | 4,513,047 | - | 96.12% | 4,141 |
| 2022 ARMs | 351,639 | 92.95% | 9.23% | 2,068 |
| 2022 FRMs | 3,457,887 | -23.38% | 90.77% | 4,214 |
| 2023 ARMs | 253,887 | -27.80% | 8.30% | 1,923 |
| 2023 FRMs | 2,804,149 | -18.91% | 91.70% | 4,704 |
| 2024 ARMs | 205,125 | -19.21% | 6.59% | 1,678 |
| 2024 FRMs | 2,905,681 | 3.62% | 93.41% | 4,543 |
| 2025 ARMs | 256,763 | 25.17% | 8.16% | 1,698 |
| 2025 FRMs | 2,890,358 | -0.53% | 91.84% | 4,406 |
Adjustable-Rate Mortgage Borrowers
No longer the shady lending product of the 2000s, today’s ARMs come with consumer protections, safer underwriting rules, and rate adjustment caps.
“Prior to the crash, guidelines were a bit more loose. Qualifying with income was a lot easier in many aspects,” Shawn Yerkes, group president at Genstone Companies, said on a recent episode of the Real Estate Update podcast.
“Nowadays, you have to prove your income and stay within a debt-to-income ratio threshold. Also, ARMs have been structured a lot more by investors to limit risk, not only for themselves but the borrower. You don’t have these negative amortization loans anymore.”
Negative amortization financing was popular in the 2000s, as it offered a rock-bottom payment. The catch was that principal was usually added to the loan balance, leaving many homeowners underwater. In many cases, “neg am” loans were used by borrowers who couldn’t afford the normal payment. But times – and ARMs – have changed.
Today, the typical ARM borrower has a much stronger financial profile than those taking out adjustable-rate mortgages just a couple of decades ago.
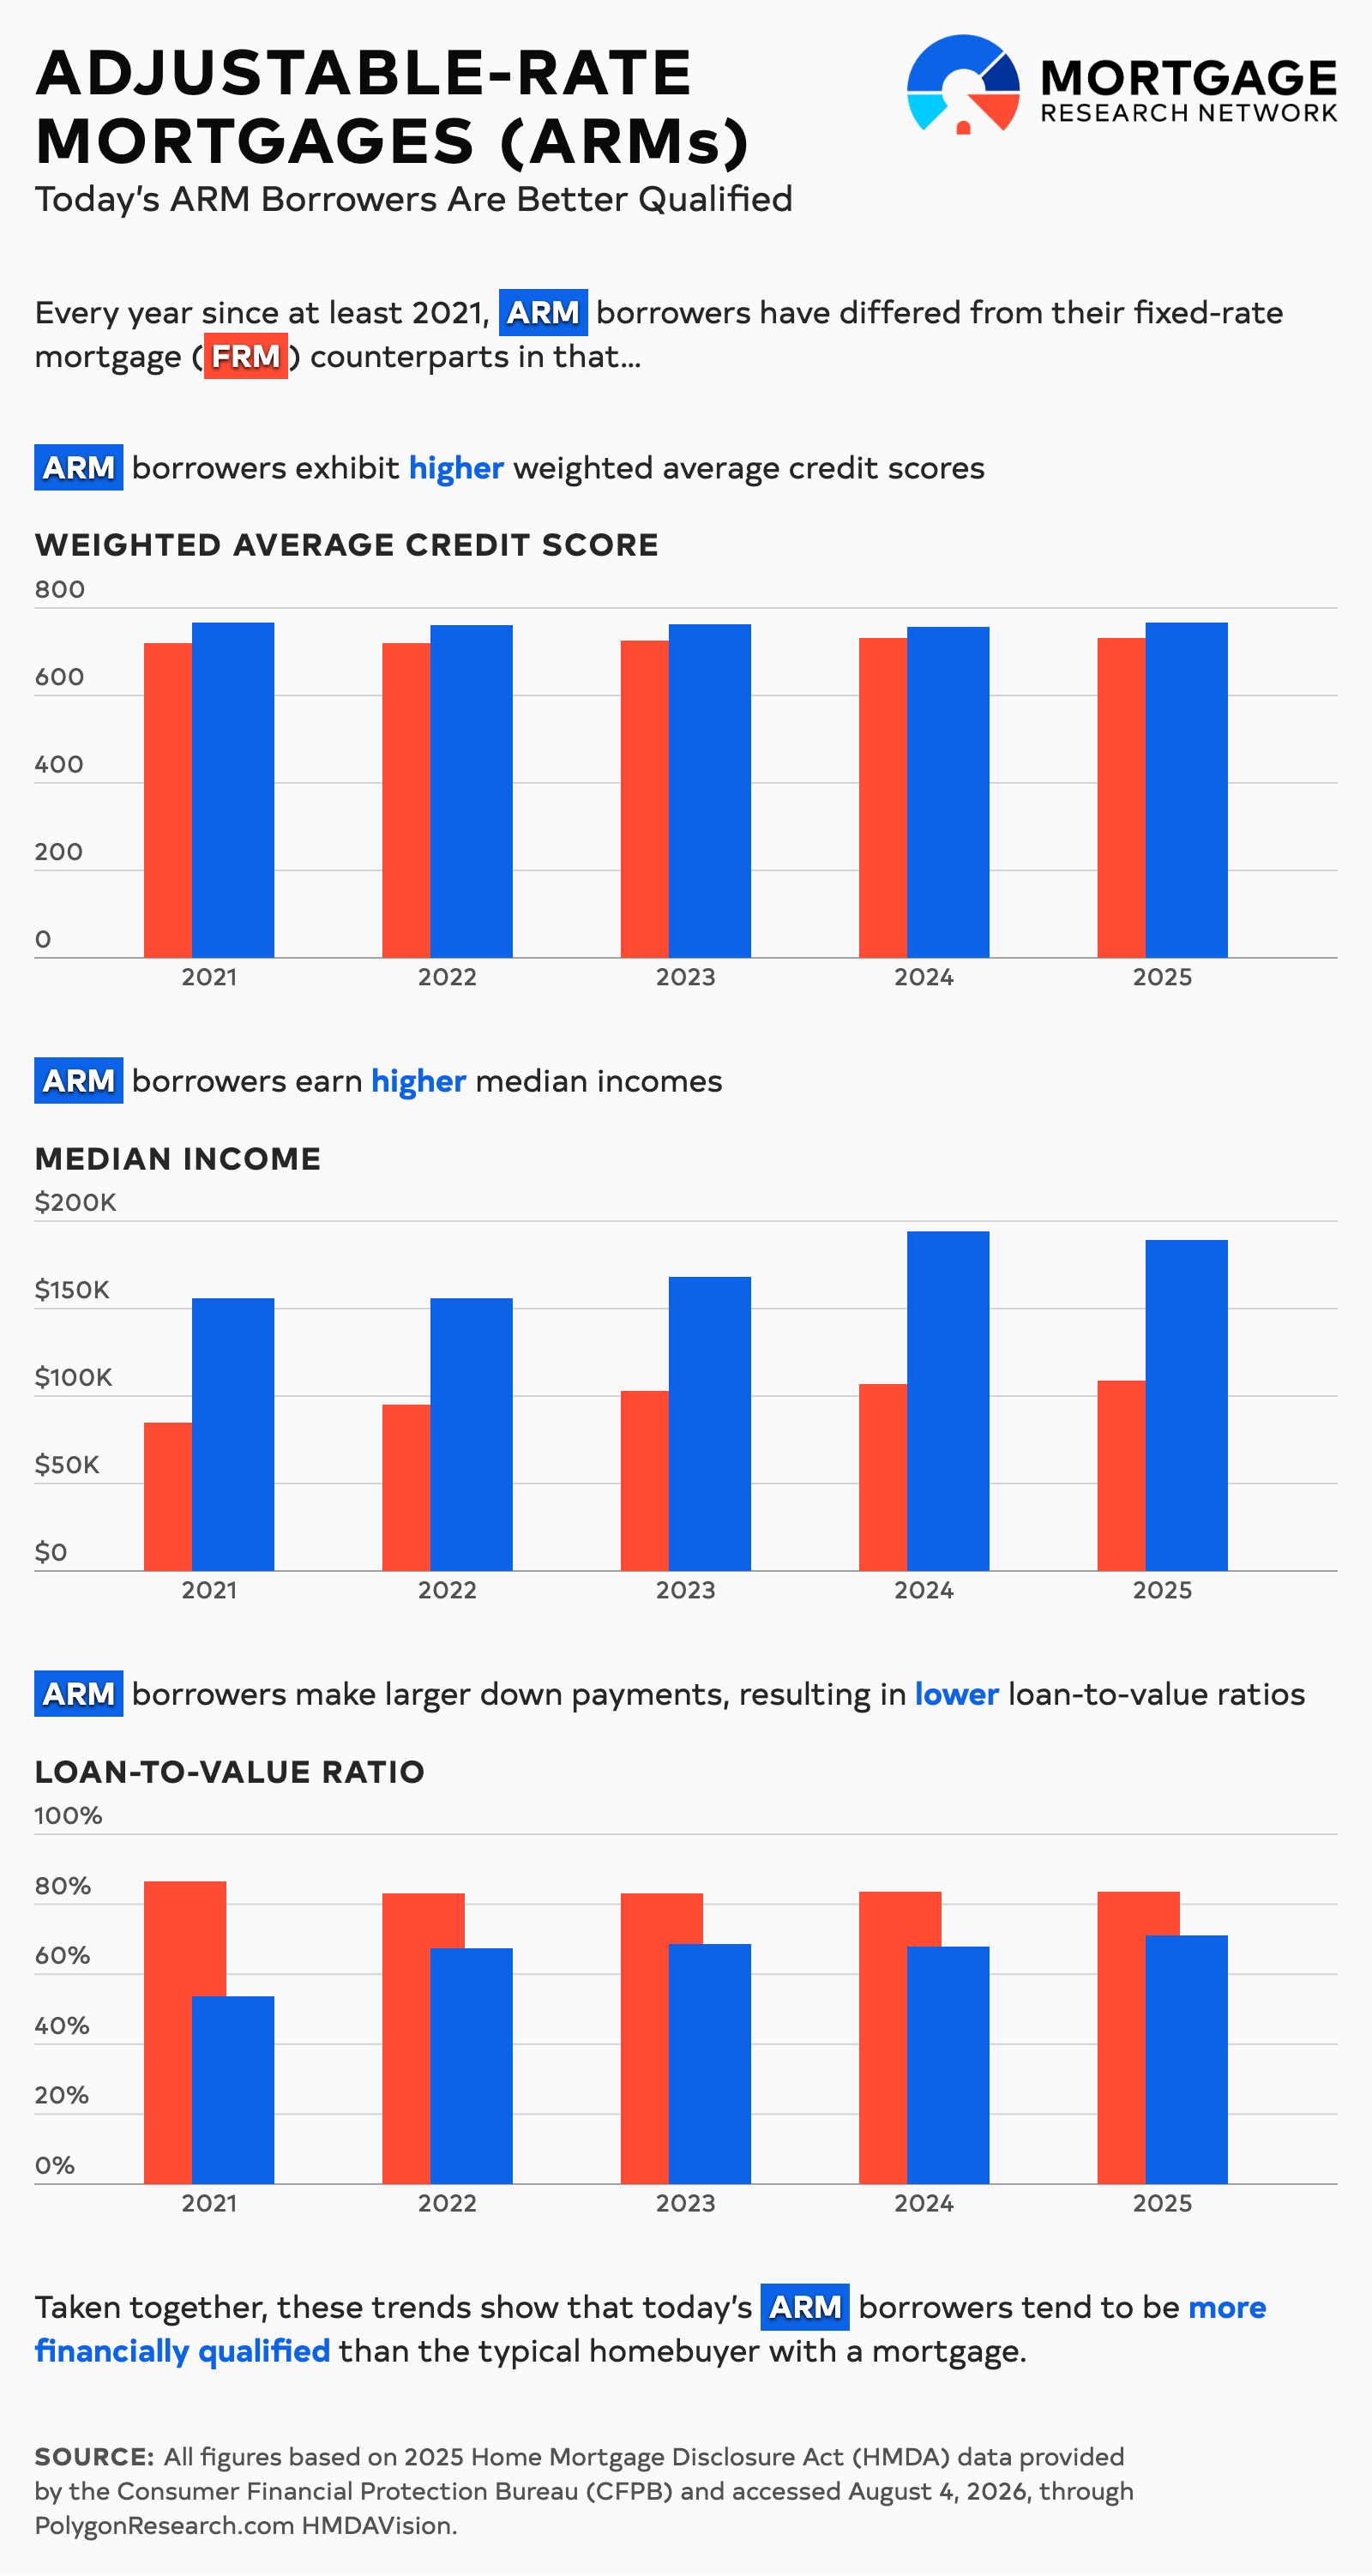
The latest HMDA data revealed that ARMs can even be considered a financing tool for the homebuying elite. An analysis by Mortgage Research Network showed a marked difference in credit profiles for adjustable versus fixed-rate borrowers. ARM borrowers exhibited higher weighted average credit scores every year from 2021 to 2025, with the disparity ranging between 25 and 49 points.
| Year | 2021 | 2022 | 2023 | 2024 | 2025 |
|---|---|---|---|---|---|
| ARM Weighted Average Credit Score | 767.4 | 760.1 | 761.8 | 756.1 | 757.5 |
| FRM Weighted Average Credit Score | 718.8 | 720.1 | 725.6 | 731.1 | 732.1 |
| Credit Score of ARM Borrower | +48.6 | +40 | +36.2 | +25 | +25.4 |
Further, ARM borrowers made much more money over that timeframe, with the median applicant income averaging 73.1%, or $72,800, higher than FRM borrowers. In 2025, the median ARM applicant had an income of $189,000 compared to $109,000 for FRM applicants. It’s no wonder then that the highest volume of ARMs can be found in some of the most expensive cities.
| Year | 2021 | 2022 | 2023 | 2024 | 2025 |
|---|---|---|---|---|---|
| ARM Median Applicant Income | $156,000 | $156,000 | $168,000 | $194,000 | $189,000 |
| FRM Median Applicant Income | $85,000 | $95,000 | $103,000 | $107,000 | $109,000 |
| Median Applicant Income Delta | $71,000 | $61,000 | $65,000 | $87,000 | $80,000 |
Additionally, ARM homebuyers put much more down on their purchases, instantly building more equity in their property. ARM originations had higher loan amounts on home prices nearly double that of FRM loans. Still, ARM borrowers were able to make larger down payments, resulting in much lower loan-to-value (LTV) ratios. ARM homebuyers in 2025 had an average LTV of 71% while FRM buyers stood at 83.6%.
| Median Loan Amount | Median Property Value | Loan-to-Value Ratio | |
|---|---|---|---|
| 2021 ARMs | $335,000 | $625,000 | 53.60% |
| 2021 FRMs | $275,000 | $325,000 | 84.62% |
| 2022 ARMs | $395,000 | $585,000 | 67.52% |
| 2022 FRMs | $295,000 | $355,000 | 83.10% |
| 2023 ARMs | $395,000 | $575,000 | 68.70% |
| 2023 FRMs | $295,000 | $355,000 | 83.10% |
| 2024 ARMs | $445,000 | $655,000 | 67.94% |
| 2024 FRMs | $305,000 | $365,000 | 83.56% |
| 2025 ARMs | $465,000 | $655,000 | 70.99% |
| 2025 FRMs | $305,000 | $365,000 | 83.56% |
ARM borrowing tends to rise when interest rates run relatively high since that’s typically when the spread widens between them and fixed rates.
“When rates were in the 2’s and 3’s, there was really nowhere for them to go,” said Yerkes. “At those lower rates, investors aren’t at risk of being refinanced, so they were willing to give really low 30-year fixed loans to lock in that rate. Now, as rates are going up, you can definitely lock in an ARM and are generally looking at substantial savings.”
In 2021, the average 30-year fixed rate sat at 2.96%, and the 182k ARMs originations made up about 3.9% of the purchase market. When the average rate spiked to 5.34% in 2022, ARM volume nearly doubled to 352k, resulting in a 9.2% market share.
ARM numbers varied in the years since, most recently reaching 257k originations and an 8.2% market share behind 2025’s 6.6% average 30-year fixed mortgage rate.
| Year | 2021 | 2022 | 2023 | 2024 | 2025 | 2026* |
|---|---|---|---|---|---|---|
| Average 30-Year Fixed Rate | 2.96% | 5.34% | 6.81% | 6.72% | 6.60% | 6.33% |
Via Freddie Mac’s Primary Mortgage Market Survey. *2026 data through August 8.
Through nearly two-thirds of 2026, the average 30-year fixed rate sits lower than 2025’s, which could mean tepid ARM origination volume. However, rates rose over the summer, most recently climbing to 6.69% for the week ending August 8. How they progress in the fall and winter could determine whether 2026 will be a big year for ARMs. We’ll find out once the next batch of HMDA data gets released in 2027.
Choosing the Right ARM Lender for You
Whether it’s a good time to get an ARM is borrower-specific, according to Yerkes.
“There are obviously benefits to having an adjustable rate; you can get a lower rate, which gives you more buying power,” he said. “But you want to make sure you can afford what that adjusted payment might be in the future. The big risk is just understanding how much your loan can adjust.”
If you’re ready to begin, reach out to a local ARM lender to see if you qualify.
All figures based on 2025 Home Mortgage Disclosure Act (HMDA) data provided by the Consumer Financial Protection Bureau (CFPB) and accessed August 4, 2026, through PolygonResearch.com HMDAVision.
Methodology: HMDAVision sorts credit score data by 20-point ranges. We used the midpoint of each range to calculate each year’s weighted averages