


As a benefit for their service, mortgages backed by the Department of Veterans Affairs (VA) offer veterans and military members a faster and more affordable path to homeownership.
VA home loans have more lenient credit standards, require no down payment, and typically come with below-market interest rates. With affordability being a major pain point and home prices high enough to make you say, ‘Whiskey Tango Foxtrot,’ getting a VA loan can be a helpful financing option. The program is also rising in popularity.
VA Mortgage Trends
In 2025, VA purchase loan originations increased 5.5% annually — five times the growth rate of overall purchase mortgage volume. Moreover, the VA share of total originations inched up each year from 9.2% in 2021 to 10.5% in 2025 — a high-watermark dating back to at least 2018.
| Year | VA Purchase Originations | YoY Growth | VA Share of Overall Originations |
|---|---|---|---|
| 2025 | 330,345 | 5.50% | 10.50% |
| 2024 | 313,187 | 2.20% | 10.10% |
| 2023 | 306,562 | -17.40% | 10.00% |
| 2022 | 370,923 | -14.20% | 9.70% |
| 2021 | 432,061 | -0.40% | 9.20% |
| 2020 | 433,735 | 7.20% | 9.90% |
| 2019 | 404,656 | 7.30% | 10.10% |
| 2018 | 377,126 | 9.80% |
VA Mortgages by State
Established in the original GI Bill back in 1944, VA mortgages are guaranteed by the government and financed through private lenders. They benefit qualified military members and their families by providing a handful of homebuying advantages.
With a VA loan, you can purchase a primary residence with zero down payment, and no monthly mortgage insurance or debt-to-income (DTI) ratio requirement. They also have lower average interest rates compared to conventional home loans — a difference reaching nearly 50 basis points for 30-year fixed-rate mortgages, as of June 10, 2026.
To find where VA loans are most common, Mortgage Research Network analyzed the latest Home Mortgage Disclosure Act (HMDA) data for 2025 through Polygon Research's HMDAVision. Almost 1,200 lenders originated 330,345 owner-occupied VA purchase mortgages on 1–4 unit properties
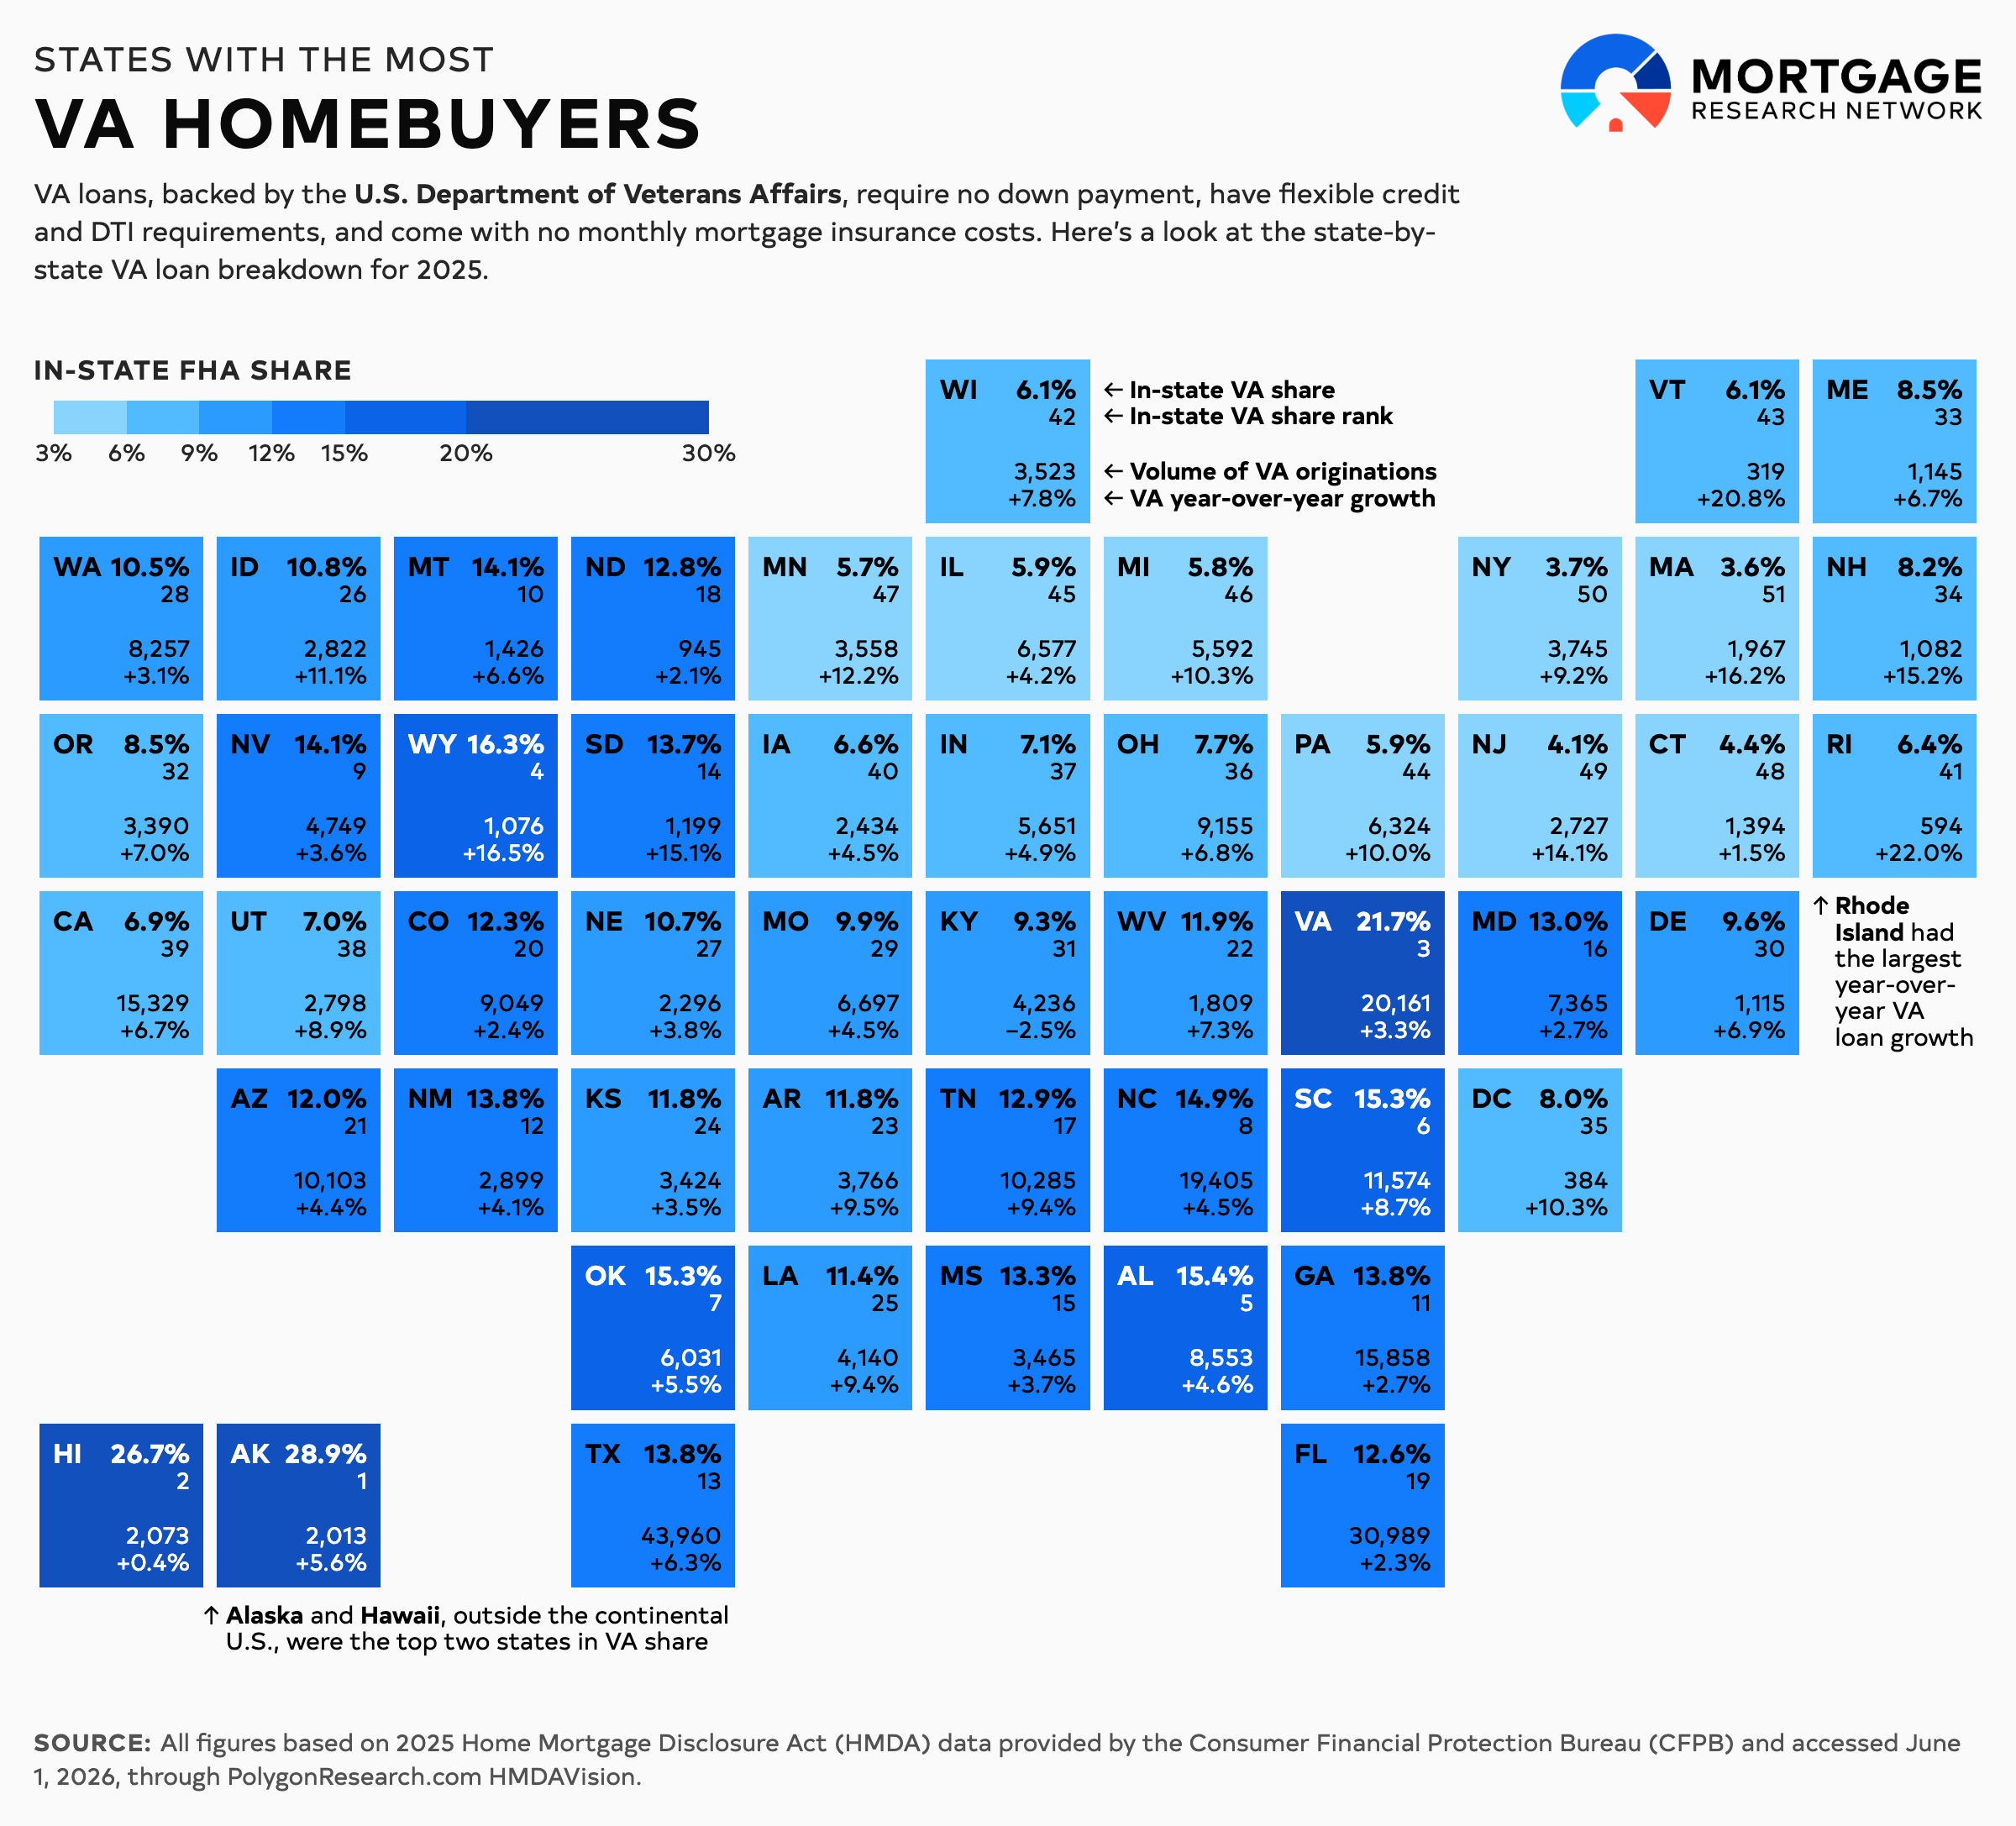
The top two states in VA share came outside the continental U.S., with 28.9% in Alaska and 26.7% in Hawaii. Behind them stood Virginia’s 21.7%, Wyoming’s 16.3% and Alabama’s 15.4%.
Small states had the largest annual gains in VA loan volume, as Rhode Island and Vermont saw respective year-over-year growth rates of 22% and 20.8%. Wyoming followed at 16.5% before heading back to New England with 16.2% in Massachusetts and 15.2% in New Hampshire.
The table below breaks down VA purchase origination data by state, ranked by in-state VA-share, based on 2025 HMDA data.
| Rank | State | In-State VA Share | VA Originations | VA YoY Growth | Share of Total U.S. VA Volume |
|---|---|---|---|---|---|
| 1 | Alaska | 28.90% | 2,013 | 5.60% | 0.60% |
| 2 | Hawaii | 26.70% | 2,073 | 0.40% | 0.60% |
| 3 | Virginia | 21.70% | 20,161 | 3.30% | 6.10% |
| 4 | Wyoming | 16.30% | 1,076 | 16.50% | 0.30% |
| 5 | Alabama | 15.40% | 8,553 | 4.60% | 2.60% |
| 6 | South Carolina | 15.30% | 11,574 | 8.70% | 3.50% |
| 7 | Oklahoma | 15.30% | 6,031 | 5.50% | 1.80% |
| 8 | North Carolina | 14.90% | 19,405 | 4.50% | 5.90% |
| 9 | Nevada | 14.10% | 4,749 | 3.60% | 1.40% |
| 10 | Montana | 14.10% | 1,426 | 6.60% | 0.40% |
| 11 | Georgia | 13.80% | 15,858 | 2.70% | 4.80% |
| 12 | New Mexico | 13.80% | 2,899 | 4.10% | 0.90% |
| 13 | Texas | 13.80% | 43,960 | 6.30% | 13.30% |
| 14 | South Dakota | 13.70% | 1,199 | 15.10% | 0.40% |
| 15 | Mississippi | 13.30% | 3,465 | 3.70% | 1.00% |
| 16 | Maryland | 13.00% | 7,365 | 2.70% | 2.20% |
| 17 | Tennessee | 12.90% | 10,285 | 9.40% | 3.10% |
| 18 | North Dakota | 12.80% | 945 | 2.10% | 0.30% |
| 19 | Florida | 12.60% | 30,989 | 2.30% | 9.40% |
| 20 | Colorado | 12.30% | 9,049 | 2.40% | 2.70% |
| 21 | Arizona | 12.00% | 10,103 | 4.40% | 3.10% |
| 22 | West Virginia | 11.90% | 1,809 | 7.30% | 0.50% |
| 23 | Arkansas | 11.80% | 3,766 | 9.50% | 1.10% |
| 24 | Kansas | 11.80% | 3,424 | 3.50% | 1.00% |
| 25 | Louisiana | 11.40% | 4,140 | 9.40% | 1.30% |
| 26 | Idaho | 10.80% | 2,822 | 11.10% | 0.90% |
| 27 | Nebraska | 10.70% | 2,296 | 3.80% | 0.70% |
| 28 | Washington | 10.50% | 8,257 | 3.10% | 2.50% |
| 29 | Missouri | 9.90% | 6,697 | 4.50% | 2.00% |
| 30 | Delaware | 9.60% | 1,115 | 6.90% | 0.30% |
| 31 | Kentucky | 9.30% | 4,236 | -2.50% | 1.30% |
| 32 | Oregon | 8.50% | 3,390 | 7.00% | 1.00% |
| 33 | Maine | 8.50% | 1,145 | 6.70% | 0.30% |
| 34 | New Hampshire | 8.20% | 1,082 | 15.20% | 0.30% |
| 35 | District of Columbia | 8.00% | 384 | 10.30% | 0.10% |
| 36 | Ohio | 7.70% | 9,155 | 6.80% | 2.80% |
| 37 | Indiana | 7.10% | 5,651 | 4.90% | 1.70% |
| 38 | Utah | 7.00% | 2,798 | 8.90% | 0.80% |
| 39 | California | 6.90% | 15,329 | 6.70% | 4.60% |
| 40 | Iowa | 6.60% | 2,434 | 4.50% | 0.70% |
| 41 | Rhode Island | 6.40% | 594 | 22.00% | 0.20% |
| 42 | Wisconsin | 6.10% | 3,523 | 7.80% | 1.10% |
| 43 | Vermont | 6.10% | 319 | 20.80% | 0.10% |
| 44 | Pennsylvania | 5.90% | 6,324 | 10.00% | 1.90% |
| 45 | Illinois | 5.90% | 6,577 | 4.20% | 2.00% |
| 46 | Michigan | 5.80% | 5,592 | 10.30% | 1.70% |
| 47 | Minnesota | 5.70% | 3,558 | 12.20% | 1.10% |
| 48 | Connecticut | 4.40% | 1,394 | 1.50% | 0.40% |
| 49 | New Jersey | 4.10% | 2,727 | 14.10% | 0.80% |
| 50 | New York | 3.70% | 3,745 | 9.20% | 1.10% |
| 51 | Massachusetts | 3.60% | 1,967 | 16.20% | 0.60% |
Applying for a VA Loan
The VA loan program has helped generations of U.S. servicemen and servicewomen purchase houses and build the personal wealth associated with homeownership.
In general, veterans are eligible for a VA loan if their service time checks one of the following boxes:
90 consecutive days on active duty during wartime
181 consecutive days on active duty during peacetime
6 years in the National Guard or Reserve
VA mortgages don’t need a down payment, have flexible DTI standards, and, technically, no credit score minimum (though most VA lenders want at least 620). You also must plan to live in the home as VA loans aren’t allowed on secondary residences or investment properties.
See MRN’s rundown on VA loans for a full scope of information.
Find The Right VA Lender For You
Nearly 1,200 lenders originated VA purchase loans in 2025, so you have a multitude of financing options if you’re a qualifying veteran, military member, or surviving spouse.
Finding a lender with high VA loan volume could ease your application process by leaning on their copious underwriting experience. Of course, getting rate quotes with multiple lenders is a proven negotiation strategy since rates typically vary from shop to shop. Shaving even a few basis points off your mortgage rate adds up over time.
All figures based on 2025 Home Mortgage Disclosure Act (HMDA) data provided by the Consumer Financial Protection Bureau (CFPB) and accessed June 1, 2026, through PolygonResearch.com HMDAVision.


")