

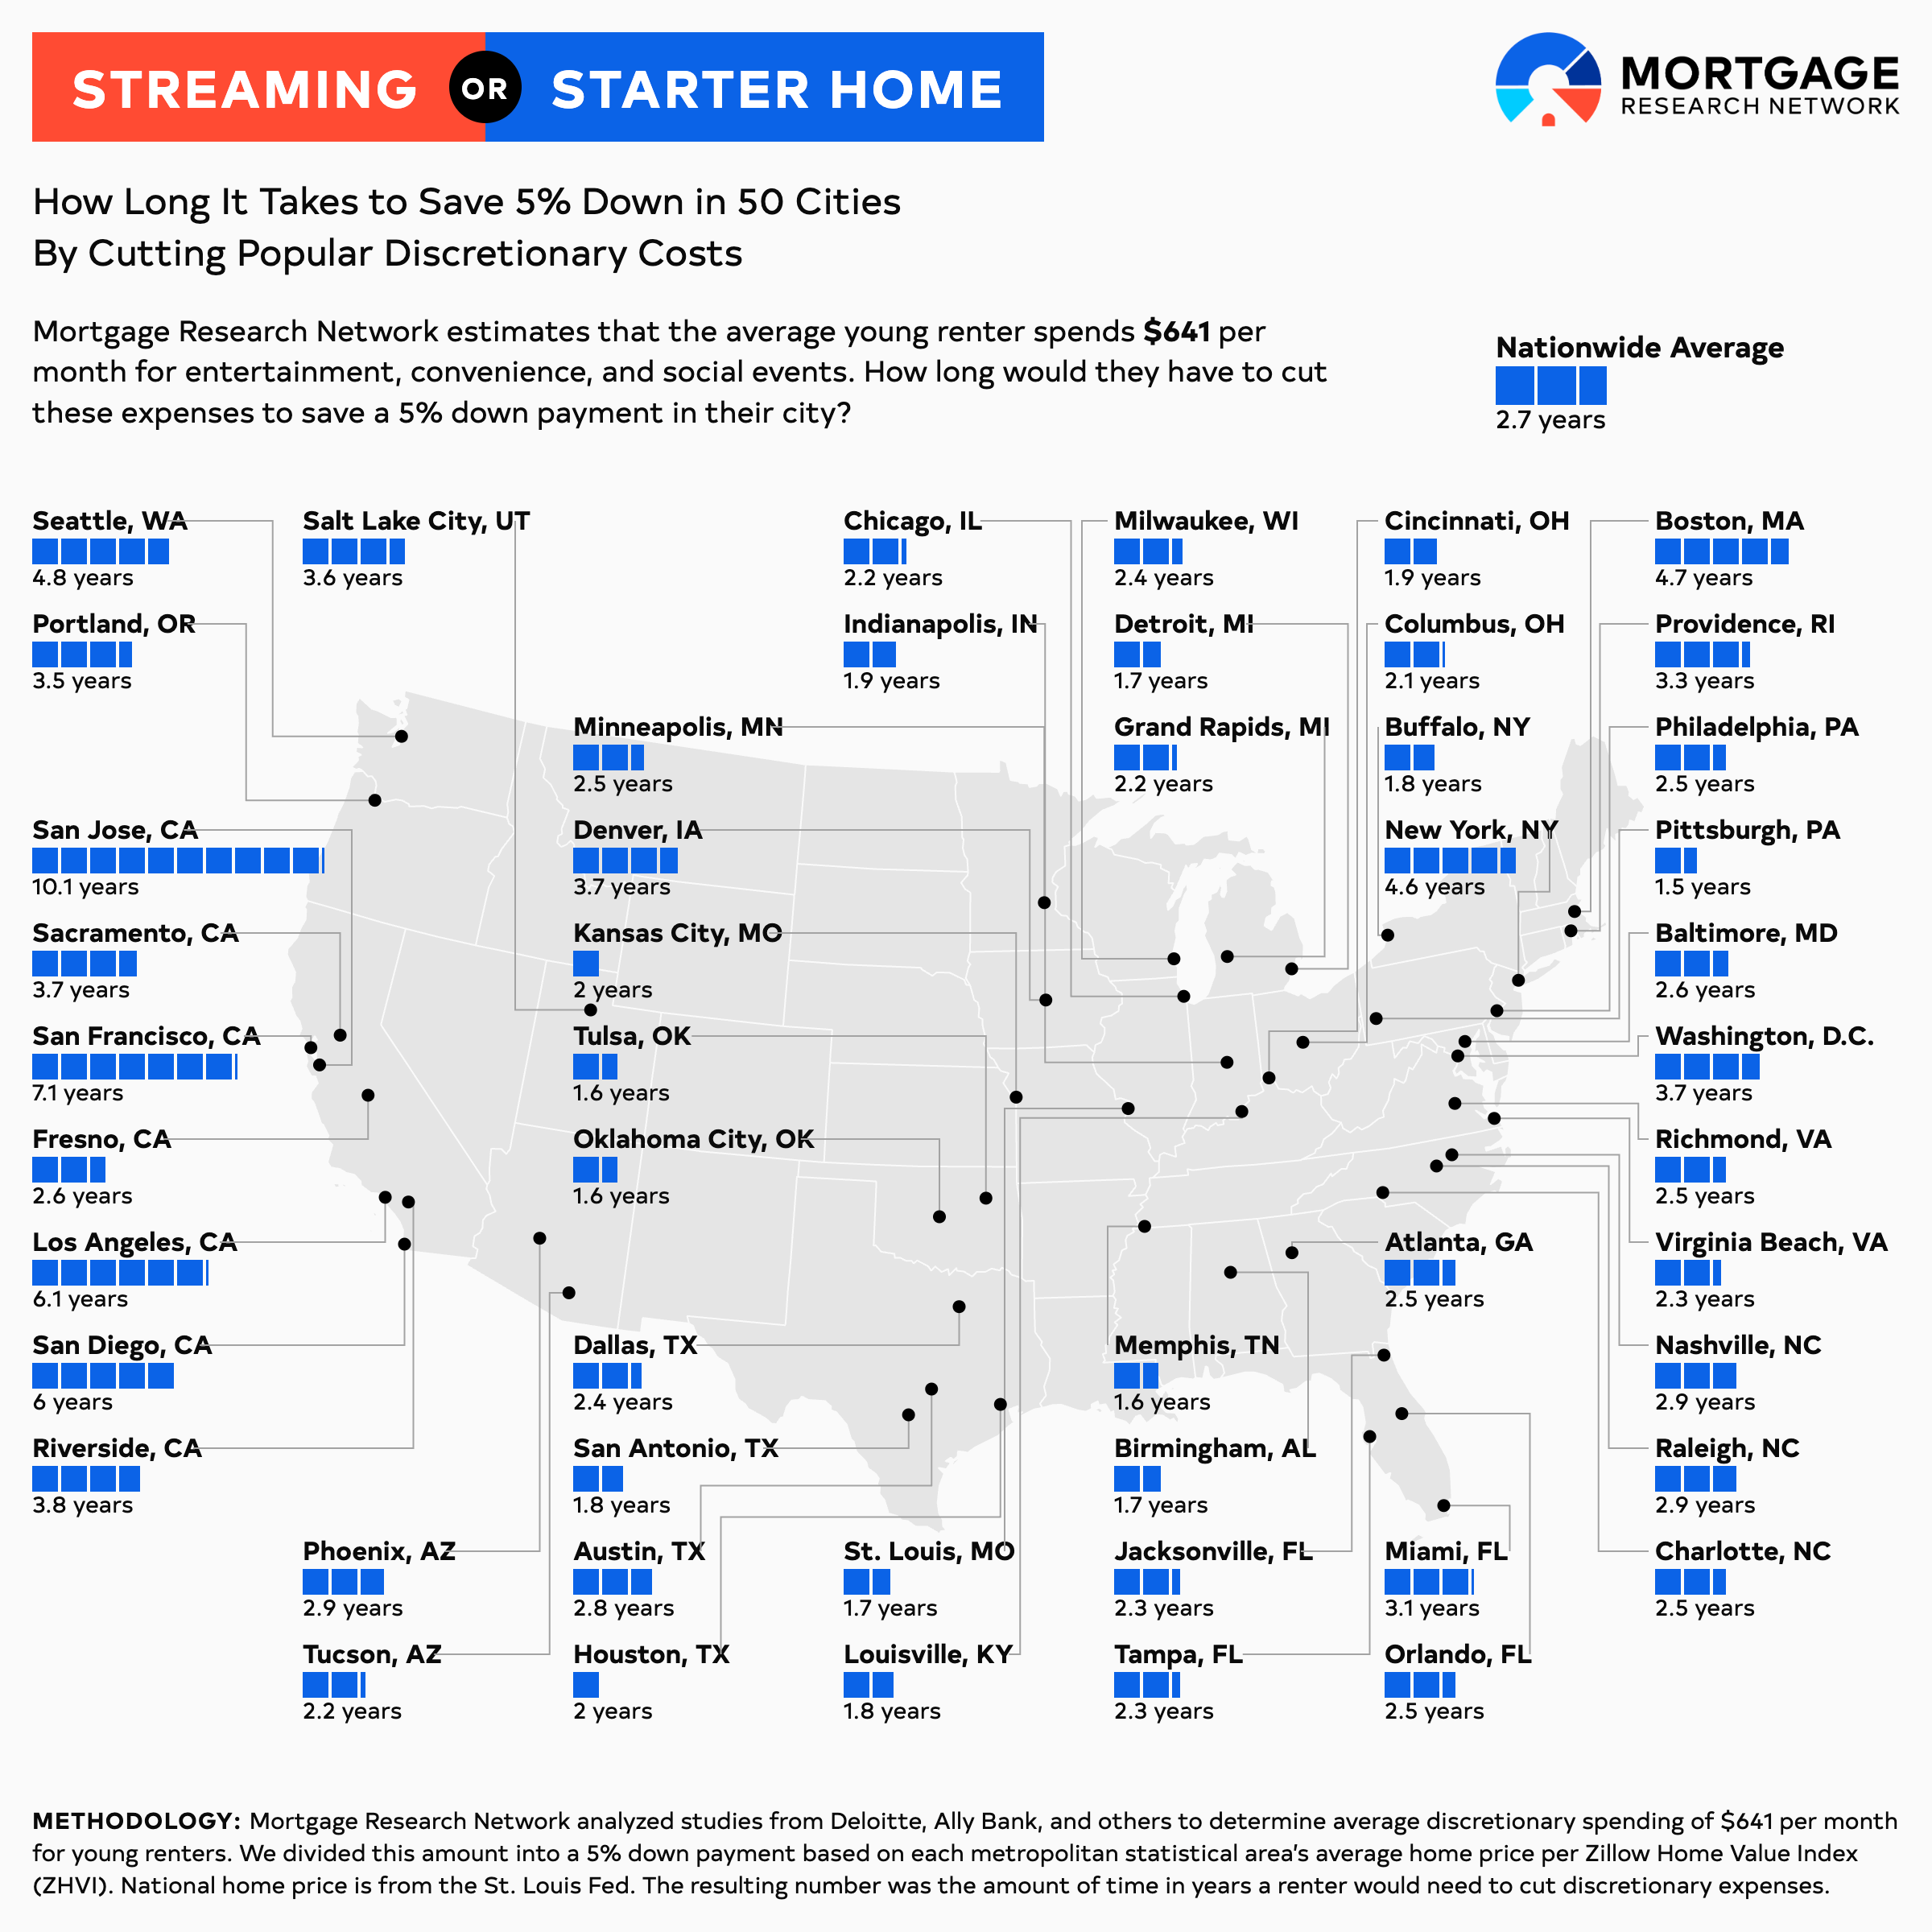
Mortgage Research Network analyzed how long it could take renters to save a 5% down payment in 50 U.S. cities by cutting common discretionary expenses.
For many, the biggest barrier to buying a home isn’t motivation, it’s math. Housing costs and interest rates have climbed, entry-level inventory is tight, paying high rent leaves little left over each month. The National Association of Realtors (NAR) reports that first-time buyers now make up just 21% of the market, an all-time low1.
Some say renters, especially younger ones, have brought it on themselves. They order DoorDash while hailing an expensive Uber and streaming Netflix on their brand-new iPhone. They can’t afford a home due to “unnecessary” expenses that previous generations didn’t waste money on (undoubtedly only because these services weren’t invented yet).
But the data doesn’t back up the accusations. According to a Redfin study2, nearly 28% of 24-year-olds today are homeowners compared to 24.5% of millennials and 23.5% of Gen Xers at the same age.
What is true is that nearly everyone has experienced lifestyle creep: they sign up for Netflix, but soon want to watch something on Hulu or Disney+. They hail an Uber for the first time on a business trip when the company is paying, but it becomes a habit at home.
That’s why Mortgage Research Network aimed to answer this question: How long would a renter have to cut a set of discretionary expenses to save a 5% down payment in their city?
The most reliable studies seem squarely aimed at younger consumers, citing data about the cost of social events, gatherings, and clothes. So this study focuses on younger renters, but the principles apply to anyone.
List of Discretionary Expenses For Young Renters
Every renter is unique in their spending habits. But in an effort to nail down averages, reliable sources such as Deloitte’s Digital Media Trends, an Ally Bank survey, and others were used to determine typical spending. See the full methodology at the end of the study.
Video and music streaming: $80/month
Food delivery: $118/month
Social events & gatherings: $250/month
Clothes, cosmetics & gadgets: $193/month
Total: $641/month
Not every renter spends this much, or anything at all, on these items. The goal, however, is for any prospective homebuyer of any age to examine their spending habits to see what they can cut out to accomplish their goal.
Even saving half this much would yield $320 per month. Being frugal, but less on the extreme side, is better than nothing: it’s a positive step toward a goal that can reap rewards for years to come.
Redirecting $641/month Can Change the Homebuying Timeline
Our model centers on $641 per month in discretionary spending. Redirected into savings, that’s nearly $7,700 per year. In many metros, that kind of consistent saving can turn “someday” into a clear timeline.
Based on the U.S. national home price of $410,800 according to the St. Louis Fed, saving $641/month could reach 5% down by October 2028, just 2.7 years from now.
That timeframe can vary widely by city:
Birmingham: 1.7 years (September 2027)
Dallas, Texas: 2.4 years (June 2028)
Seattle: 4.8 years (November 2030)
The quickest timeline was found in Pittsburgh at just 1.5 years (July 2027). On the other end of the spectrum, renters would have to cut expenses until February 2036 in San Jose, Calif., a full 10.1 years.
How Long It Would Take To Save a 5% Down Payment: Top 50 U.S. Cities
A 5% down payment is recommended for a conventional loan for better rates and mortgage insurance fees, and to avoid income limits that often come with 3%-down loans. However, many buyers will qualify for a 3% down conventional loan or an FHA loan requiring 3.5% down.
Those who buy in a rural area and meet income limits may be eligible for a zero-down USDA home loan.
Still, saving 5% of the home price is a reasonable goal. Any funds not required for a down payment can be saved for emergencies or to furnish or improve the home.
Time To Save a 5% Down Payment: Top 50 U.S. Cities
| Market | Median Home Price | 5% Down Payment | Years Saving $641/Month | 5% Down Payment Reached |
|---|---|---|---|---|
| United States | $410,800 | $20,540 | 2.7 | October 2028 |
| Atlanta, Ga. | $381,271 | $19,064 | 2.5 | July 2028 |
| Austin, Texas | $428,390 | $21,419 | 2.8 | November 2028 |
| Baltimore, Md. | $396,874 | $19,844 | 2.6 | August 2028 |
| Birmingham, Ala. | $254,873 | $12,744 | 1.7 | September 2027 |
| Boston, Mass. | $721,075 | $36,054 | 4.7 | October 2030 |
| Buffalo, N.Y. | $278,902 | $13,945 | 1.8 | November 2027 |
| Charlotte, N.C. | $385,094 | $19,255 | 2.5 | August 2028 |
| Chicago, Ill. | $340,733 | $17,037 | 2.2 | April 2028 |
| Cincinnati, Ohio | $299,343 | $14,967 | 1.9 | January 2028 |
| Columbus, Ohio | $323,122 | $16,156 | 2.1 | March 2028 |
| Dallas, Texas | $363,356 | $18,168 | 2.4 | June 2028 |
| Denver, Colo. | $569,930 | $28,496 | 3.7 | October 2029 |
| Detroit, Mich. | $262,145 | $13,107 | 1.7 | October 2027 |
| Fresno, Calif. | $404,288 | $20,214 | 2.6 | September 2028 |
| Grand Rapids, Mich. | $344,969 | $17,248 | 2.2 | April 2028 |
| Houston, Texas | $306,425 | $15,321 | 2.0 | January 2028 |
| Indianapolis, Ind. | $288,010 | $14,401 | 1.9 | December 2027 |
| Jacksonville, Fla. | $350,205 | $17,510 | 2.3 | May 2028 |
| Kansas City, Mo. | $314,952 | $15,748 | 2.0 | February 2028 |
| Los Angeles, Calif. | $945,428 | $47,271 | 6.1 | March 2032 |
| Louisville, Ky. | $270,580 | $13,529 | 1.8 | November 2027 |
| Memphis, Tenn. | $241,603 | $12,080 | 1.6 | August 2027 |
| Miami, Fla. | $472,130 | $23,607 | 3.1 | February 2029 |
| Milwaukee, Wis. | $371,266 | $18,563 | 2.4 | June 2028 |
| Minneapolis, Minn. | $382,160 | $19,108 | 2.5 | July 2028 |
| Nashville, Tenn. | $451,356 | $22,568 | 2.9 | January 2029 |
| New York, N.Y | $709,880 | $35,494 | 4.6 | September 2030 |
| Oklahoma City, Okla. | $240,735 | $12,037 | 1.6 | August 2027 |
| Orlando, Fla. | $387,115 | $19,356 | 2.5 | August 2028 |
| Philadelphia, Pa. | $380,104 | $19,005 | 2.5 | July 2028 |
| Phoenix, Ariz. | $446,926 | $22,346 | 2.9 | December 2028 |
| Pittsburgh, Pa. | $225,318 | $11,266 | 1.5 | July 2027 |
| Portland, Ore. | $544,435 | $27,222 | 3.5 | August 2029 |
| Providence, R.I. | $505,220 | $25,261 | 3.3 | May 2029 |
| Raleigh, N.C. | $439,338 | $21,967 | 2.9 | December 2028 |
| Richmond, Va. | $382,022 | $19,101 | 2.5 | July 2028 |
| Riverside, CA | $579,877 | $28,994 | 3.8 | November 2029 |
| Sacramento, Calif. | $574,751 | $28,738 | 3.7 | October 2029 |
| Salt Lake City, Utah | $555,919 | $27,796 | 3.6 | September 2029 |
| San Antonio, Texas | $278,854 | $13,943 | 1.8 | November 2027 |
| San Diego, Calif. | $916,746 | $45,837 | 6.0 | January 2032 |
| San Francisco, Calif. | $1,099,607 | $54,980 | 7.1 | March 2033 |
| San Jose, Calif. | $1,547,794 | $77,390 | 10.1 | February 2036 |
| Seattle, Wash. | $739,435 | $36,972 | 4.8 | November 2030 |
| St. Louis, Mo. | $266,378 | $13,319 | 1.7 | October 2027 |
| Tampa, Fla. | $358,904 | $17,945 | 2.3 | May 2028 |
| Tucson, Ariz. | $342,635 | $17,132 | 2.2 | April 2028 |
| Tulsa, Okla. | $245,894 | $12,295 | 1.6 | September 2027 |
| Virginia Beach, Va. | $360,624 | $18,031 | 2.3 | June 2028 |
| Washington, D.C. | $574,999 | $28,750 | 3.7 | October 2029 |
Why The Housing Market Is Tough Even For Frugal Renters
Even modest down payments can feel farther away today because the underlying housing market has changed.
Harvard’s Joint Center for Housing Studies notes that home prices rose sharply from 2019 into the mid-2020s, and that prices continued rising in early 2025, adding pressure to would-be first-time buyers trying to save while prices move.
At the same time, the market for low-cost rentals has tightened over the past decade. The same Harvard report points to a 30% decline in the number of inflation-adjusted rentals priced below $1,000/month in 2023 versus 2013. It’s important to keep in mind that not all expenses for renters are discretionary. Some are unavoidable.
And student loans are not helping younger renters. The Education Data Initiative states that Gen Z holds an average student loan balance of $22,948. The current federal student loan rate of 6.39% means a payment of $259 per month for 10 years. Millennials fare much worse, with average student loans totaling $40,438 with an estimated payment of $457.
Homebuying: A Balancing Act
Younger renters won’t give up every convenience and technology any more than Gen X would have given up buying Nirvana CDs.
But the lesson in this study is that there are non-essential expenses anyone can cut out to achieve a financial goal, whether that’s homeownership, investing, or building an emergency fund.
The key is to start small. Those savings will compound and potentially motivate younger renters to save more. The snowball effect could result in homeownership in just a few years, even if it seems impossible at the start.
Methodology
To arrive at the number of years young renters should cut expenses to attain homeownership, we first started with spending averages for common discretionary expenses.
Video streaming: Deloitte 2025 Digital Media Trends Report. Average of 4 subscriptions totaling $69.
Audio streaming: Apple and Spotify. $11 (at time of research).
Food delivery: Empower Retirement $118/mo.
Social events and gatherings: Ally Bank Survey of Gen Z Consumers. $250/mo.
Clothes, cosmetics, and gadgets including phones: Self’s Gen Z Financial Habits Report. $193/mo.
Total: $641 per month.
We divided $641 into a 5% down payment based on each metropolitan statistical area’s average home price per Zillow Home Value Index (ZHVI) All Homes Time Series for September 2025. For the U.S. average, we used St. Louis Fed data. The resulting number was the amount of time in years a renter would need to cut discretionary expenses to buy a home, and the month and year that translates to based on a February 1, 2026 starting date.
1. National Association of Realtors®' 2025 Profile of Home Buyers and Sellers.
2. Redfin Homeownership Rate by Generation


