

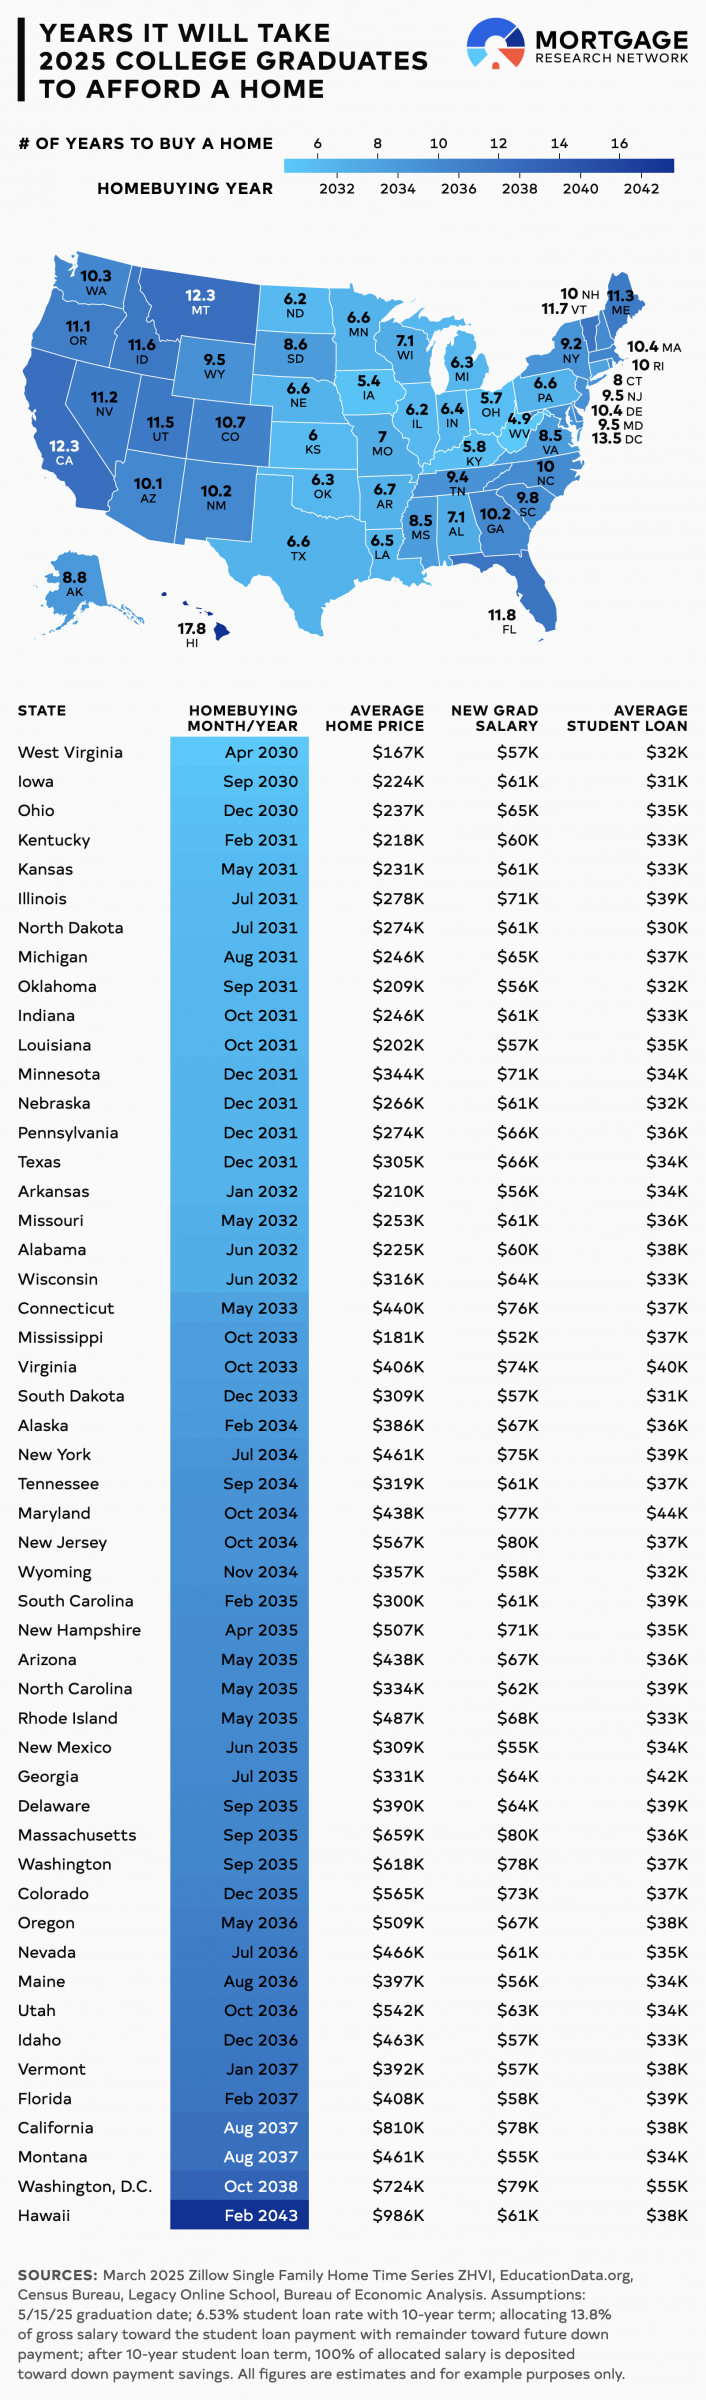
Homebuyers in West Virginia can buy a home in the least amount of time, just 4.9 years, while those in Hawaii may need nearly 18.
Highlights
- Student loan debt adds nearly five years to the average homebuying timeline for new graduates.
- Geography matters: In Hawaii, grads may have to wait until 2043 to buy, while in West Virginia, it’s 2030.
- Washington, D.C. offers the highest starting salary at $79,235, but also the largest average student debt load of $54,795.
- Nationally, the average 10% down payment tops $38,500, no small amount to save with the average student loan payment of $410 per month.
A MortgageResearch.com analysis reveals a sobering milestone for the Class of 2025: The average college graduate is unlikely to be able to afford a home until April 2034 — nearly a decade after tossing their graduation caps — due to a triple threat of soaring home prices, student loan debt and modest starting salaries.
The study estimated how long it would take to save a 10% down payment in each state, factoring estimated new grad starting salaries, average home prices and average student loan balances and payments.
Some states proved more homebuyer-friendy than others. West Virginia graduates could save a 10% down payment in just 4.9 years, making them homeowners by April 2030. But in Hawaii, it could take 17.8 years to save 10% of the typical home — $98,573 — pushing homeownership to February 2043.
| State | Years to Buy | Homebuying Month/Yr With Student Loans | Homebuying Month/Yr Without Student Loans | Avg. Home Price | Avg. Starting Salary | Avg. Student Loan |
|---|---|---|---|---|---|---|
| U.S. Average | 9.0 | April 2034 | August 2029 | $385,994 | $64,598 | $36,043 |
| Alabama | 7.1 | June 2032 | January 2028 | $225,431 | $60,156 | $37,709 |
| Alaska | 8.8 | February 2034 | June 2029 | $385,786 | $67,221 | $35,821 |
| Arizona | 10.1 | May 2035 | February 2030 | $438,202 | $66,683 | $35,675 |
| Arkansas | 6.7 | January 2032 | January 2028 | $210,385 | $56,314 | $33,858 |
| California | 12.3 | August 2037 | October 2032 | $809,893 | $78,278 | $38,168 |
| Colorado | 10.7 | December 2035 | December 2030 | $564,641 | $73,072 | $37,392 |
| Connecticut | 8.0 | May 2033 | July 2029 | $440,359 | $75,975 | $36,672 |
| Delaware | 10.4 | September 2035 | September 2029 | $389,709 | $64,157 | $38,683 |
| District of Columbia | 13.5 | October 2038 | December 2031 | $723,888 | $79,235 | $54,795 |
| Florida | 11.8 | February 2037 | June 2030 | $407,588 | $58,009 | $39,262 |
| Georgia | 10.2 | July 2035 | January 2029 | $330,822 | $64,185 | $42,026 |
| Hawaii | 17.8 | February 2043 | December 2036 | $985,731 | $61,448 | $38,158 |
| Idaho | 11.6 | December 2036 | March 2031 | $462,848 | $57,342 | $33,281 |
| Illinois | 6.2 | July 2031 | February 2028 | $277,745 | $71,127 | $39,055 |
| Indiana | 6.4 | October 2031 | April 2028 | $245,728 | $60,573 | $33,243 |
| Iowa | 5.4 | September 2030 | January 2028 | $224,230 | $60,754 | $30,925 |
| Kansas | 6.0 | May 2031 | February 2028 | $231,494 | $60,620 | $33,119 |
| Kentucky | 5.8 | February 2031 | December 2027 | $217,893 | $60,185 | $33,470 |
| Louisiana | 6.5 | October 2031 | November 2027 | $201,844 | $57,107 | $34,866 |
| Maine | 11.3 | August 2036 | July 2030 | $397,214 | $55,592 | $34,292 |
| Maryland | 9.5 | October 2034 | June 2029 | $438,225 | $76,748 | $43,692 |
| Massachusetts | 10.4 | September 2035 | April 2031 | $658,566 | $79,985 | $35,529 |
| Michigan | 6.3 | August 2031 | February 2028 | $246,409 | $64,810 | $36,974 |
| Minnesota | 6.6 | December 2031 | November 2028 | $344,161 | $71,254 | $34,071 |
| Mississippi | 8.5 | October 2033 | November 2027 | $180,641 | $52,266 | $37,254 |
| Missouri | 7.0 | May 2032 | April 2028 | $253,141 | $61,418 | $35,675 |
| Montana | 12.3 | August 2037 | June 2031 | $460,766 | $54,642 | $33,945 |
| Nebraska | 6.6 | December 2031 | June 2028 | $265,570 | $61,239 | $32,377 |
| Nevada | 11.2 | July 2036 | November 2030 | $466,050 | $60,775 | $34,589 |
| New Hampshire | 10.0 | April 2035 | June 2030 | $507,234 | $71,325 | $34,884 |
| New Jersey | 9.5 | October 2034 | June 2030 | $566,880 | $80,114 | $37,201 |
| New Mexico | 10.2 | June 2035 | May 2029 | $309,382 | $55,421 | $34,280 |
| New York | 9.2 | July 2034 | October 2029 | $461,467 | $74,504 | $38,690 |
| North Carolina | 10.0 | May 2035 | March 2029 | $334,161 | $62,338 | $38,695 |
| North Dakota | 6.2 | July 2031 | July 2028 | $274,293 | $61,164 | $29,647 |
| Ohio | 5.7 | December 2030 | December 2027 | $236,650 | $64,933 | $35,033 |
| Oklahoma | 6.3 | September 2031 | January 2028 | $209,265 | $55,663 | $32,103 |
| Oregon | 11.1 | May 2036 | November 2030 | $509,299 | $67,100 | $37,829 |
| Pennsylvania | 6.6 | December 2031 | May 2028 | $273,566 | $65,678 | $36,267 |
| Rhode Island | 10.0 | May 2035 | July 2030 | $486,649 | $68,084 | $33,270 |
| South Carolina | 9.8 | February 2035 | December 2028 | $300,430 | $60,590 | $38,770 |
| South Dakota | 8.6 | December 2033 | April 2029 | $309,377 | $56,517 | $30,928 |
| Tennessee | 9.4 | September 2034 | February 2029 | $319,357 | $61,189 | $36,886 |
| Texas | 6.6 | December 2031 | August 2028 | $304,532 | $66,474 | $33,581 |
| Utah | 11.5 | October 2036 | July 2031 | $541,641 | $63,247 | $33,746 |
| Vermont | 11.7 | January 2037 | May 2030 | $392,398 | $56,741 | $38,404 |
| Virginia | 8.5 | October 2033 | April 2029 | $406,016 | $74,468 | $40,137 |
| Washington | 10.3 | September 2035 | January 2031 | $618,364 | $78,485 | $36,762 |
| West Virginia | 4.9 | April 2030 | June 2027 | $167,346 | $56,648 | $32,358 |
| Wisconsin | 7.1 | June 2032 | November 2028 | $315,763 | $64,320 | $32,628 |
| Wyoming | 9.5 | November 2034 | October 2029 | $356,665 | $58,331 | $31,503 |
The study assumed an aggressive savings model: diverting 13.8% of income toward student loans and a future down payment. This rate is three times higher than the current personal saving rate according to the Bureau of Economic Analysis.
Extreme saving might be necessary for most aspiring homebuyers, as student loan debt delays homeownership by an average of four years and eight months, according to the analysis.
The typical Class of 2025 grad is projected to earn $64,598 annually, according to data from Census Bureau data compiled by Legacy Online School. Before student loan payments, new grads could save about $743 per month. But with average loan payments of $410, that figure drops to just $333 monthly. Without student loans, a new grad could buy a home by August 2029 — but with student debt, they would need to wait until April 2034.
The pattern holds across the country. The analysis projects homeownership delays compared to when no debt is present:
Connecticut: 3 years, 10 months
Virginia: 4 years, 6 months
Mississippi: 4 years, 11 months
Washington, D.C.: 6 years, 10 months
State-level differences in home prices and salaries also shift the timeline. While the national average home costs $385,994, requiring a $38,599 down payment, states like West Virginia (average price: $167,346) help shorten the wait. But low home prices alone don’t guarantee quicker access. In Mississippi, where homes average just $180,641, low starting salaries (just $52,266) limit grads to $177-per-month savings, pushing their homebuying date to October 2033.
At the other end of the spectrum, Washington, D.C. tempts grads with the nation’s highest entry-level salary ($79,235). But D.C. residents also hold the highest average student debt ($54,795), delaying homeownership until October 2038 — more than 13 years post-graduation.
Despite the bleak averages, grads don’t have to wait a decade or longer. Several strategies can accelerate the path to homeownership:
Exploring 0% down loan options like the USDA loan, a loan reserved for moderate-income buyers, and the VA loan, available to eligible Veterans and service members.
Finding low-down-payment options like FHA financing and 3% down conventional loans.
Negotiating seller concessions, which can reduce upfront costs.
Tapping into graduation gifts. New lending rules permit cash gifts from family and non-relatives for down payments, even without a gift letter, assuming requirements are met.
While the housing market remains the toughest for first-time buyers since the 1980s, the Class of 2025 isn’t without options. New grads only need to keep investing in their education, but that of a different kind: a learning path where the diploma comes with keys.
Methodology
The MortgageResearch.com analysis calculated how long it would take a new college graduate to buy a home using:
A 10% down payment on the average home value by state according to the Zillow Home Value Index (ZHVI) Single-Family Time Series.
Student loan payments based on average federal student loans by state per EducationData.org and the current federal student loan interest rate for undergraduates of 6.53% and a 10-year loan.
Estimated new college graduate starting salaries by state from U.S. Census Bureau data compiled by Legacy Online School.
A May 15, 2025 graduation date.
13.8% of gross income allocated toward the student loan payment, with the remainder placed in a down payment savings fund without interest.
For states requiring longer than a 10-year savings horizon, we assumed the entire savings amount is allocated toward the down payment after the 10-year mark.
The methodology does not consider private student loans and other student financing, as no information is available.
The study does not consider home price increases, raises, or dual-income homebuying. All lending figures are estimates and may vary by homebuyer.


